Forex Signals Brief December 21: USD Final Q3 GDP and Unemployment Claims on Agenda
Today's last revisions for the Q3 US GDP report won't likely affect the USD much, but we have to keep an eye on the unemployment claims

The main event of the day was the release of the UK inflation report, which provided some solid price action for this pair. The numbers indicated that CPI in the United Kingdom was substantially lower than expected in November, confirming the market’s view of faster rate reduction.
Before the data, the odds of a BOE rate cut in May were 65%, but now traders have fully priced in such a move, with an earlier rate cut in March being a coin flip. This is despite the BOE’s strong opposition last week. As a result, the pound weakened, with GBP/USD falling from 1.2710 to 1.2645 before settling around that level for the time being. The dollar remained more stable throughout, remaining mixed but stable.
In the US session, the existing house sales in the United States were higher than expected, while Conference Board consumer confidence also jumped higher to 110.7 points vs 104.00 expected. The ECB members such as Knot, Lane, and Kazaks all stated in different ways that they will “continue with the rate cuts.” The Fed’s Harker stated that the work of controlling inflation is not finished, but he did recognize that inflation trends were favorable and that the Fed was done tightening.
Today’s Market Expectations
Today the economic calendar is light during the Asian and European sessions, but it kicks off in the US session with US Jobless Claims which remains one of the most essential and real-time employment indicators. Initial Claims remain at cycle lows, indicating that layoffs have not yet increased significantly, but Continuing Claims have been growing, indicating that people are finding it more difficult to find another job after being laid off. The consensus for Initial Claims this week is 218K vs. 202K previously, but there is no estimate for Continuing Claims since the previous week’s total was 1,876K vs. 1,856K previously.
The final reading for the US Q3 GDP will also be released at the same time. The last numbers showed a decent expansion of 5.2% for the last quarter, although the numbers will be revised, they are expected to remain unchanged and this is a backward-looking figure anyway. The GDP Price Index would be important, but that’s old news as well.


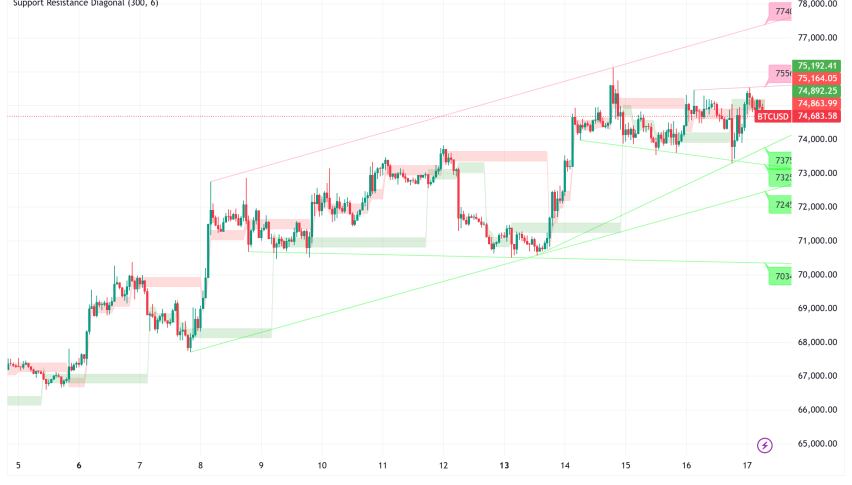
Bitcoin continues to attract strong bids as the hype surrounding a BTC ETF continues to build, allowing it to shrug off a recent drop toward $40,000 and soar back above $44,000 yesterday. There are not many Bitcoin sellers right now as the ETF approaches. That pull is considerably stronger given that the massive year-to-date Bitcoin profits offer a reason to sell after the end of the year. The December high was $44,800, and that is the next level to watch now, followed by $45,000.
BTC/USD – Daily Chart
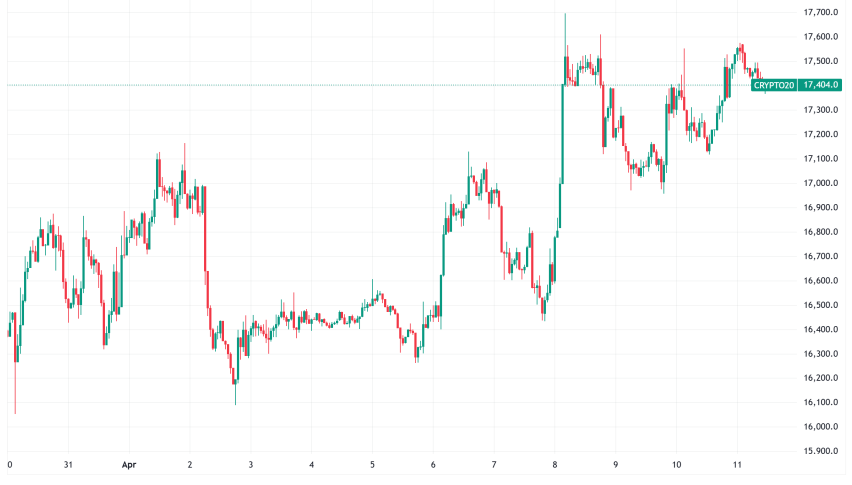
Ethereum Trades Around $2,200
ETH/USD reached $2,400 earlier this month, but has since returned significantly lower. However, the overall trend remains, with moving averages acting as support during pullbacks. On the daily chart, we had a rally off the 20 SMA (gray) last week, but the price reversed back down this week, despite the fact that the 50 SMA (yellow) is now acting as support.
Ethereum – Daily Chart
- ETH Buy Signal
- Entry Price: $1,947.38
- Stop Loss: $1,490
- Take Profit: $2,500
- Check out our free forex signals
- Follow the top economic events on FX Leaders economic calendar
- Trade better, discover more Forex Trading Strategies
- Open a FREE Trading Account
- Read our latest reviews on: Avatrade, Exness, HFM and XM
Related Articles

Sidebar rates
Related Posts
