Forex Signals Brief December 22: Will PCE Inflation Miss After Softer Revisions Yesterday?
Yesterday the PCE inflation report for Q3 was revised lower to 2.0% from 2.3%, so today's PCE will likely miss expectations too

Yesterday started slow in the Asian session, but the volatility picked up in the European session even though there weren’t many economic events, with the USD resuming the decline. The slowdown in core PCE after the Q3 revisions which fell to 2.0% from 2.3% previously, was one of the main drivers, since it shows a return to the 2.0% target before today’s PCE report and sets the stage for a softer reading.
The unemployment claims numbers for last week were excellent, but Philly Fed manufacturing figure was dismal, coming at -10.5 points. Stock markets erased the majority of yesterday’s severe loss, as bulls reclaimed the upper hand and mitigated yesterday’s devastating bearish outside reversal.
USD/JPY slipped lower ahead of the US session, and the selling continued following the US data, resulting in a 100-pip decline to 142.00, where it concluded the day. The Euro gained ground and closed at 1.1000. The commodity currencies won again, with the AUD and CAD both riding high on optimism about the global economy in 2024. Both are expected to finish at their highest levels of the day, with the AUD especially strong.
Today’s Market Expectations
Today the economic calendar starts with the Japanese Core CPI Y0Y which is predicted to cool off further to 2.5% in November, from 2.9% in October, while there is no agreement on the other measures at the time of writing, even though the Headline CPI YoY was 3.3% in October and the Core-Core CPI YoY was 4.0%. This inflation report comes on the last day before the Christmas holidays and after the Bank of Japan Policy Decision, so the market reaction is likely to be moderate unless there are major surprises.
Later we have the US PCE inflation report, with forecasts for a fall further in November, after similar results in the CPI and PPI inflation figures. Core PCE inflation is expected to be a relatively moderate 0.06% in November, bringing the annual reading of core PCE down to 3.1% in November from 3.5% in October. It would also mean that the six-month annualized rate would have fallen to 1.9%, falling short of the Fed’s 2% price target, and it might even be weaker after yesterday’s downward revisions.
Yesterday the volatility wasn’t particularly hgih, but the price action was enough to present us with many trading opportunities throughout the day, so we opened six trading signals in total, with a major focus on commodities such as Gold and Crude Oil. We closed the day with four winning forex signals while two reached the SL targets.
GOLD Keeps returing to the Highs
Gold prices rose to new record highs earlier this month, smashing the previous high of $2,075, but quickly fell below $2,000 after reaching $2,040. However, the FOMC meeting, which sounded dovish for the USD, provided a further lift to gold, sending it shooting higher last week, with moving averages acting as support on the daily chart. The price soared off the 100 SMA (green) on Tuesday, sending it to $2,047, but it returned to $2,030 yesterday, achieving the TP target of our sell Gold signal from above $2,040, and we chose to reverse the trade down there. 
XAU/USD – 240 minute chart
EUR/USD Closes at 1.10 Again
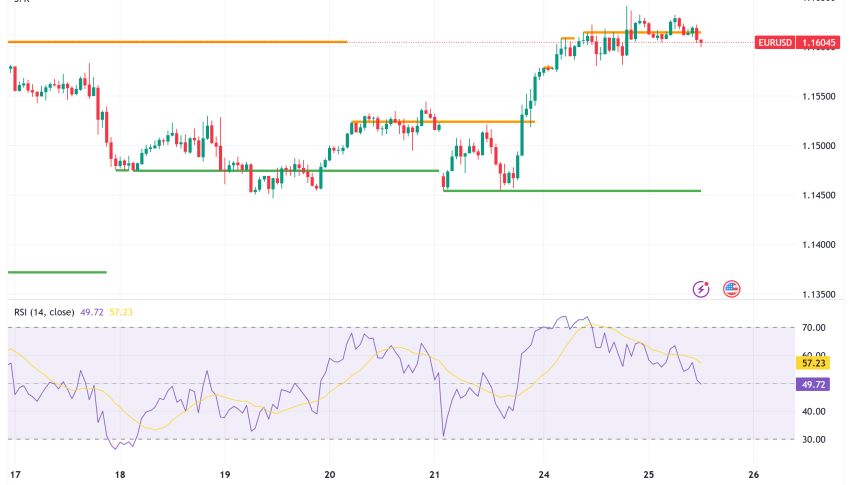
Yesterday, the USD continued to decline again, extending Tuesday’s price action, as US government yields plummeted, with 10-year US bond yields going below 4%. This boosted the EUR/USD, which rebounded to 1.0705 from a low of 1.0930 earlier in the day, as buyers pushed to push the price over 1.10. They failed again, showing that these levels are too high for this couple.
EUR/USD – 240 minute chart
Cryptocurrency Update
BITCOIN Sticks to $44,000
Bitcoin continues to attract strong bids as the hype surrounding a BTC ETF continues to build, allowing it to shrug off a recent drop toward $40,000 and soar back above $44,000 yesterday. There are not many Bitcoin sellers right now as the ETF approaches. That pull is considerably stronger given that the massive year-to-date Bitcoin profits offer a reason to sell after the end of the year. The December high was $44,800, and that is the next level to watch now, followed by $45,000.
BTC/USD – Daily Chart
Ethereum Trades Around $2,200
ETH/USD reached $2,400 earlier this month, but has since returned significantly lower. However, the overall trend remains, with moving averages acting as support during pullbacks. On the daily chart, we had a rally off the 20 SMA (gray) last week, but the price reversed back down this week, despite the fact that the 50 SMA (yellow) is now acting as support.
Ethereum – Daily Chart
- ETH Buy Signal
- Entry Price: $1,947.38
- Stop Loss: $1,490
- Take Profit: $2,500
- Check out our free forex signals
- Follow the top economic events on FX Leaders economic calendar
- Trade better, discover more Forex Trading Strategies
- Open a FREE Trading Account


