Gold Heads Into 2025 feeling Bullish, but Has to Overcome the Previous Record High at $2,075
Gold has been showing resilience in 2023, opening around $1,800 and continuing higher, where it formed a support zone, which held...
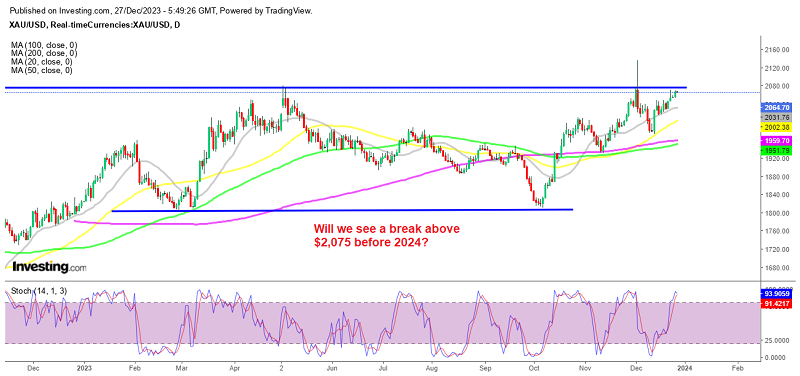
Gold has been showing resilience in 2023, opening around $1,800 and continuing higher, where it formed a support zone, which held throughout the year. Buyers have been in control during most of the year and they broke above the all-time high at $2,075 in the first week of December, but the price retreated lower below $1,900 again, however buyers have stepped in and now they are threatening the previous resistance for a second time.
We have seen a few technical setbacks in Gold this year. However, XAU/USD has now risen to sit higher, recovering from around $1,974 after finding support at the 50 SMA (yellow) on the daily chart. The price bounced off that moving average and now the 20 SMA (gray) has turned into support for Gold, indicating that the buying pressure remains strong.
Gold Daily Chart – Can Buyers Push Above the Resistance?

Smaller MAs are now turning into support for XAU
However, the important resistance zone from the 2,020 high at around $2,075 remains on the daily, weekly, and monthly charts, and it is the critical level to watch heading into next year. The break above this level early this month came as a bit of a fluke, as the price spiked higher on geopolitical news. So, this time buyers don’t have the same stamina as back then.
So, Gold remains in demand as the economic and political uncertainties remain high across the globe. January is the best month for XAU though. But the rally since November also comes on the back of a weaker USD, while bond yields have been retreating lower, which is a key driver for GOLD in particular. The market is stepping up pricing for central bank rate cuts in 2024 which has been pulling the USD lower and pushing Gold prices higher. But, buyers will have to push above $2,075 first to keep the bullish momentum going, so one step at a time.
Gold Live Chart
- Check out our free forex signals
- Follow the top economic events on FX Leaders economic calendar
- Trade better, discover more Forex Trading Strategies
- Open a FREE Trading Account