Forex Signals Brief January 3: Will FOMC Minutes Confirm Rate Cut Expectations?
Today we have the ISM manufacturing and JOLTS job openings, but markets will likely be focused on the FOMC meeting minutes
Last year started with markets expecting the FED to stop raising rates and reverse policy, which kept the USD soft in Q1 and Q2, but the FED kept continued to keep the hawkisgh tone until recently, based on a strong labour market. However, they started giving dovish signals in Q4 and the USD turned bearish while risk assets turned bullish. So, that’s how 2024 ended, with the USD in retreat and stock markets at record highs.
Last week the volatility was low, being in the Christmass period, however there was enough price action, as traders made their last adjustmnets before the end of the year. Unemployment claims jumped to 218K from 206K previously, beating expectations of 211K while the Spanish CPI (consumer price index) inflation ticked lower to 3.1%, which showes that inflation continues to head toward 2% in the Eurozone.
This means that the European Central Bank will accept the reality and announce the policy shift soon, as the FED did last month, starting to cut interest ratesas well. The Central Bank of Israel lower rates to 4.50% yesterday from 4.75% previously, opening the door for other central banks to start doing so.
Today’s Market Expectations
Today the economic calendar is light in the Asian and European sessions, however in the US session the US ISM Manufacturing PMI is projected to be 47.1 points for December, up from 46.7 points in November but after yesterday’s Manufacturing PMI which showed a decline, today’s numbers will likely miss expectations. This indicator fell further into contraction in November, according to the most recent report, and the general consensus was bleak. The dismal statistics persisted in December, with the US S&P Global Manufacturing PMI falling short deeper in contraction, reinforcing the Manufacturing sector’s drag on the economy.
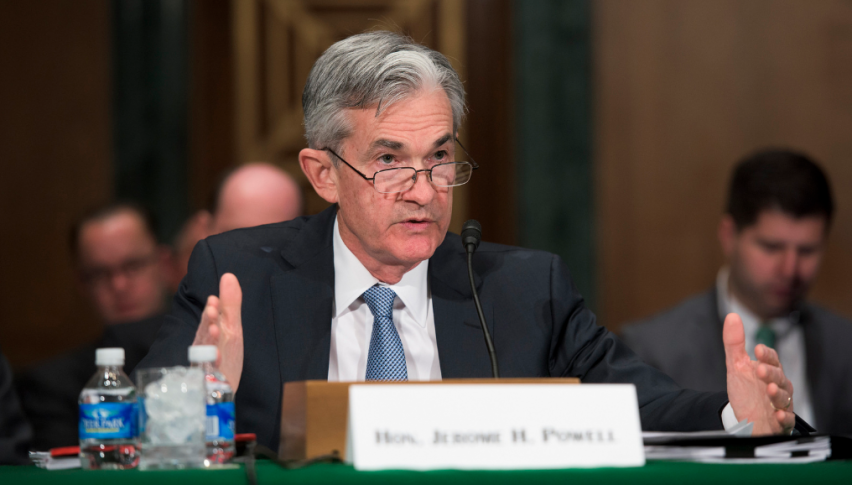
The JOLTS job openings in the United States are predicted to increase slightly to 8.850M, up from 8.733M previously. Job Openings fell significantly more than projected in the most recent report, with the lowest reading since March 2021. The labor market continues to soften as fewer jobs are available rather than more layoffs, which, when combined with dropping inflation, supports the soft-landing scenario. Such events, however, tend to occur just before a recession, so only time will tell if the “most crowded trade on Wall Street” was, in fact, the correct one all along. Later in the evening, the FED will release the latest FOMC meeting minutes, which likely reinforce the view that rate cuts are coming soon, dragging on the USD.


BTC/USD has been one of the best-performing assets this year, but it is now in a period of correction following a 160% gain. Despite the dismal situation of the economy, Bitcoin’s value has soared past $43,000 and is expected to outperform traditional assets. It started at $40,000 in December, but purchasers have been quite active, so the overall price remains positive. However, following a significant drop the day before, buyers emerged at the 20 SMA (gray), which continues to operate as support on the daily chart. In the last two days we ave seen a bonce off this moving average and yesterday BTC pushed above $45,000.
BTC/USD – Daily Chart
Ethereum Retesting Last Week’s High
Cryptocurrencies suffered significant losses in 2022, with some losing up to 80% of their market capitalization, with Ethereum falling below $5,000. However, ETH/USD has reached new highs this year, proving that the trend has been bullish all year, with moving averages continuing to push the lows higher. This week buyers returned after a retreat lower, but they failed to take out last week’s high and reach $2,500.
Ethereum – Daily Chart
- ETH Buy Signal
- Entry Price: $1,947.38
- Stop Loss: $1,490
- Take Profit: $2,500
- Check out our free forex signals
- Follow the top economic events on FX Leaders economic calendar
- Trade better, discover more Forex Trading Strategies
- Open a FREE Trading Account