EUR/USD Unfolding Bearish Reversing Pattern on the Weekly Chart
EUR/USD remained strong until the end of last year, as the USD kept declining on dovish FED rhetoric, while buyers pushed the price above...
EUR/USD remained strong until the end of last year, as the USD kept declining on dovish FED rhetoric, while buyers pushed the price above 1.11. The refusal by the ECB to announce rate cuts continued to help the bullish cause in this pair. However, a reversal occurred with the new year, and this pair was under pressure for most of the week.
the reversal was mostly driven by the rising value of the US dollar (USD), although it can be ascribed in part to the Eurozone S&P Manufacturing PMI, which dipped to 47.9 points in December, signifying further slowdown in the manufacturing sector and falling short of the projected 48.2 points. However, the ECB’s policymakers emphasized that their decisions are data-driven and unfettered by market pricing or external pressures, which continues to be a strong reason for keeping the Euro strong.
As the weekly EUR/USD chart above shows, the 200 SMA (purple) stopped the bullish climb in this pair at around 1.1140 and the price formed an upside-down doji last week, which is a bearish reversing signal. This week the bullish move continued until Friday, when the NFP and the ISM services numbers for December were released.
The NFP report looked strong at first but the details weren’t as strong which sent the USD lower, helped by the slowdown in services, as the ISM report showed. However, there is still quite some room for EUR/USD to continue slipping lower, but we will see how the Eurozone retail sales report comes tomorrow and later in the week traders will be trading the anticipation of the US CPI inflation report for December.
December 2023 US Services Report from the Institute for Supply Management![ISM services Dec chart]()
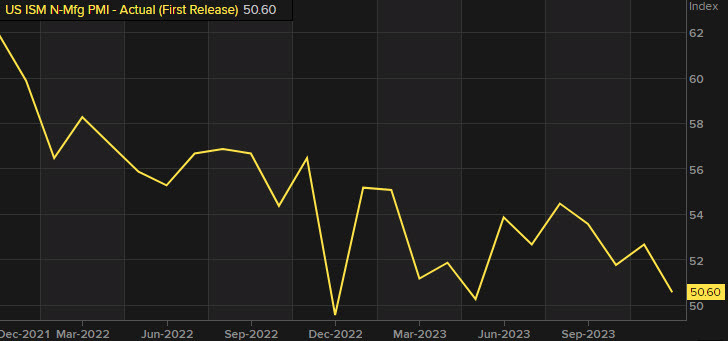
- December ISM services 50.6 points vs 52.6 points expected
- October ISM services were 52.6 points
Details:
- Employment index 43.3 points versus 50.7 points prior
- New orders 52.8 points versus 55.5 points prior
- Prices paid index 57.4 points versus 58.3 points prior
- New export orders 50.4 points versus 53.6 points prior
- Imports 49.3 points versus 53.7 points prior
- Backlog of orders 49.4 points versus 49.1 points prior
- Inventories 49.6 points versus 55.4 points prior
- Supplier deliveries 49.5 points versus 49.6 points prior
- Inventory sentiment 49.6 points versus 62.2 points prior
- Check out our free forex signals
- Follow the top economic events on FX Leaders economic calendar
- Trade better, discover more Forex Trading Strategies
- Open a FREE Trading Account


