Forex Signals Brief January 9: Australian Retail Sales Highlight the Day
Today the economic data is light, with the November retail sales from Australia expected to be the highlight of the day.

Yesterday risk sentiment was primarily negative following another terrible trading day in China, however it was mostly calm during th4e first half of the day. However, it was Oil that sparked volatility, when Saudi Arabia announced a price decrease on its grades. This resulted in a bearish reversal in crude oil, sending WTI close to $70.
This improved risk sentiment regarding inflation in the US session, causing US bond yields to turn lower, drsgging the USD down. Compounding this was a release from the FED on inflation expectations. That survey revealed a significant decline in 1,3 and5 year inflation, which the FED should take comfort in.
The Euro took advantage of the US dollar weakness, reaching 1.0980 before retreating to 1.0950, while Gold ended up lower at the end of the day, after an intitial dive and a billish reversal later, before falling again in late US trading. XAU attempted to rise beyond $2,040 but was unable to sustain the momentum.
Today’s Market Expectations
Today the economic data is light, with the November retail sales from Australia expected to be the highlight of the day. Retail sales have been increasing although they turned negative in october, postive a 0.2% decline, However, November is expected to show a piositive reversal and a 1.2% growth.
The Tokyo CPI is regarded as a leading indicator of the National inflation in Japan. The Tokyo Core CPI YoY is predicted to rise 2.1% from 2.3% previously. The headline inflation rate has been slowly declining due to energy deflation, but the Core-Core measure, which excludes food and energy prices, has been rising, with the rate now at 2.7%, considerably above the Bank of Japan’s 2% objective.


BTC/USD – Daily Chart
Ethereum Benefiting From the Bitcoin ETF
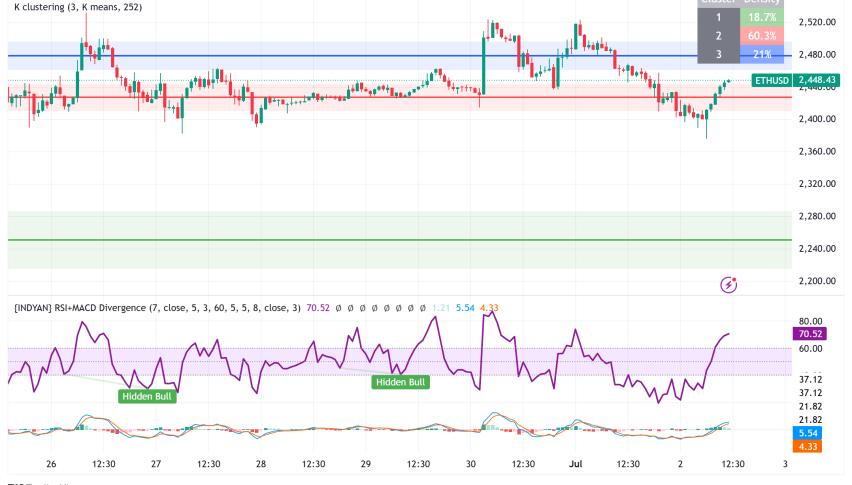
This year, ETH/USD has made new highs, indicating that the trend has been positive all year, with moving averages pushing the lows higher. Buyers reappeared this week after a brief retreat, but they were unable to break through last week’s high of $2,500. The price fell to $2,127 on Wednesday, but it reversed back up, with the 50 SMA (yellow) acting as support on the daily chart and the price climbed above $2,300.
Ethereum – Daily Chart
- ETH Buy Signal
- Entry Price: $1,947.38
- Stop Loss: $1,490
- Take Profit: $2,500
- Check out our free forex signals
- Follow the top economic events on FX Leaders economic calendar
- Trade better, discover more Forex Trading Strategies
- Open a FREE Trading Account