Will AUD/USD Resume Bullish Trend After the Retreat?
AUD/USD has been bullish since it reversed higher in October and has been steadily rising since then, gaining nearly 7 cents from the bottom
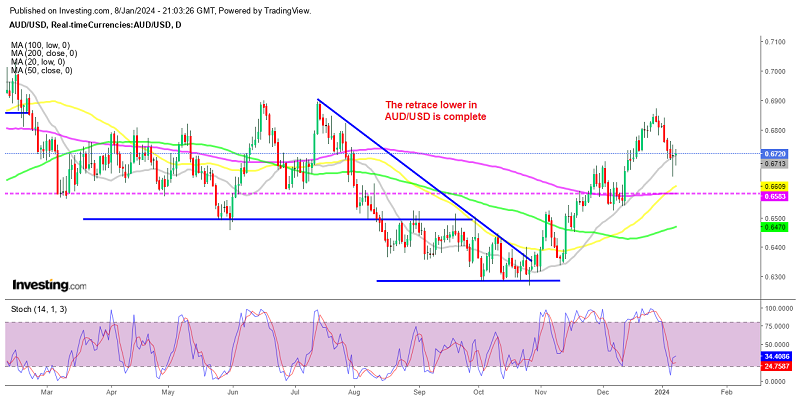
AUD/USD has been bullish since it reversed higher in October and has been steadily rising since then, gaining nearly 7 cents from the bottom to the top in the last week of December. Moving averages have turned into support on the daily chart. The 20 SMA in particular has held the retreat twice since the reversal and now the price is trading at this moving average again after last week’s retreat.
AUD/USD Daily Chart – The 20 SMA Is Holding As Support

On Friday AUD/USD dipped below the 20 daily SMA (gray) but the price reversed higher and formed a doji candlestick, after some USD selling following softer ISM services figures and a mixed US labour report. That ended the pair’s 5-day losing streak for this pair and the bullish reversal pattern indicates a shift to the upside for AUD/USD .
The larger trend is already bullish and the retreat seems complete, since the stochastic indicator is oversold on the daily chart and the doji candlesticks signal a bullish reversal after the retreat. The economic data from Australia on the other hand, has been showing mixed signals as well. Early this morning we had the Australian retail sales for November which were expected to turn positive after a -0.2% contraction in October.
November Retail Sales Report from Australia
- November Retail Sales MoM +2.0% vs +1.2% expected
- October Retail Sales were -0.2%
There is considerable skepticism about the data at this time of year, as the relatively new Black Friday sales events in Australia wreak havoc with seasonal adjustments for the months surrounding it. The Australian Bureau of Statistics is still coming to terms with the new report.
AUD/USD Live Chart
- Check out our free forex signals
- Follow the top economic events on FX Leaders economic calendar
- Trade better, discover more Forex Trading Strategies
- Open a FREE Trading Account