Forex Signals Brief January 11: All Eyes on US December CPI Numbers
Today everyone is waiting for the US CPI inflation numbers for December, which will likely get markets going after the low volatility yester

The main event yesterday was the Bitcoin ETF which was finally approved, bringing the worst-kept secret into the open which starts trading today. BTC didn’t exhibit any particular excitement after the news, as the price appears to be fixed at $46,000, but we’ll have to wait and see what happens next. Some money appears to be flooding into ETH, which went up by 10% on what could be a front-runner for that ETF, sending it above $2,500.
In other markets, the yen was the largest mover as investors lost optimism that the BOJ would normalize policy this year. This happened after dismal November wage data was reported in Asia. The US dollar was strong early on, but it weakened later, despite rising Treasury yields. The ten-year auction was soft, which contributed to raise yields, although overall movements on the day were minimal as we approach tomorrow’s CPI report.
Today’s Market Expectations
Today starts slow in the Asian and European sessions, but it kicks off in the US session with the December CPI report. US headline inflation YoY is predicted to tick higher to 3.2% from 3.1% last month, while the MoM number is expected to tick up to 0.2%, up from 0.1% in November. Core CPI YoY is anticipated to decline by 2 points to 3.8% from 4.0% in November, while the MoM number is expected to tick down to 0.2% from 0.3% previously. The market expects the first rate cut coming in March, so a strong reading might reduce expectations for a March cut to about a 50/50 possibility.
The US Unemployment Claims report will be released at the same time, with Initial Claims remaining at cycle lows, which indicates that layoffs have not yet increased much; however, Continuing Claims have risen to a new cycle high in recent months, indicating that people are finding it more difficult to find another job after being laid off. This week’s consensus is for Initial Claims to be 210K, up from 202K the previous week, but there is no estimate for Continuing Claims, since the previous week’s total was 1,855K compared to 1,886K.
Yesterday the sentiment shifted a few times, but in general markets were quiet, as traders await the US CPI inflation to come out. We didn’t open many signals as a result, however we had several signals from the previous days, with two long term signals closing in profit as Gold and the JPY continued to decline.
Booking Profit in Gold
Gold was bullish over the fourth quarter of last year, but it began to retreat in the last few days of 2023, and it appears that this may evolve into a real downtrend, as sellers continue to apply downward pressure. Attempts from buyers to reverse the price higher have ended in vain and moving averages have turned into resistance. Yesterday the price hit our TP Gold target, as the decline stretched further down.
XAU/USD – 240 minute chart
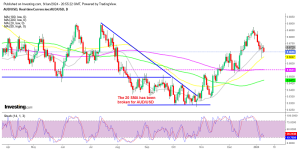
AUD/USD Continues to Trade at MAs
The AUD/USD has been falling for the past two weeks, having been bullish when it reversed higher in November, to the resistance zone below 0.69. This pair has dropped roughly 250 pips since the top, and after stalling for a few days late last week, the downturn started yesterday.
USD/CAD – 60 minute chart
Cryptocurrency Update
No Drama After the Bitcoin ETF Gets Approved by SEC
Last year, the cryptocurrency market prospered and became a safe refuge for international assets after comments that the SEC would approve a Bitcoin EFT which boosted sentiment even further, and cryptocurrencies continued to surge until the end of the year. The time of truth is today, however yesterday we saw a surge after the main SEC Twitter/X account was hacked and announced the approval of the Bitcoin ETF, sending BTC to $47,800. But, the SEC rejected the claim and BTC tumbled to $45,000 lows. Yesterday the SEC approved the ETF, but there was no price spike after that.
BTC/USD – Daily Chart
Ethereum Surges Above $2,500
This year, ETH/USD has reached new highs, demonstrating that the trend has been bullish throughout the year, with moving averages pushing lows higher. Buyers returned this week after a temporary retreat, but they were unable to break the previous week’s high of $2,500. On Wednesday, the price fell to $2,127, but then recovered, with the 50 SMA (yellow) functioning as support on the daily chart, and the price soared beyond $2,500 yesterday.
Ethereum – Daily Chart
- ETH Buy Signal
- Entry Price: $1,947.38
- Stop Loss: $1,490
- Take Profit: $2,500
- Check out our free forex signals
- Follow the top economic events on FX Leaders economic calendar
- Trade better, discover more Forex Trading Strategies
- Open a FREE Trading Account


