USD/JPY Continues Upward March but Buyers Face the 50 Daily SMA
After being bullish for most of 2023, USD/JPY reached 152 by late November, but it failed for a second time in that zone and fell to 140s.
After being bullish for most of 2023, USD/JPY reached 152 by late November, but it failed for a second time in that zone and fell to 140 lows by the end of December, with markets expecting a policy tweak by the Bank of Japan (BOJ). However, the BOJ disappointed the expectations, keeping the policy unchanged and turning the JPY bearish again, sending USD/JPY 600 pips higher.
Now markets are expecting the Bank of Japan (BoJ) to continue keeping the accommodative monetary policy for the foreseeable future. The recent earthquake in Japan has further poured cold water on rate hike expectations, while inflation is slowing in Japan. The Tokyo CPI, which is a forerunner for the Japan CPI declined once again.
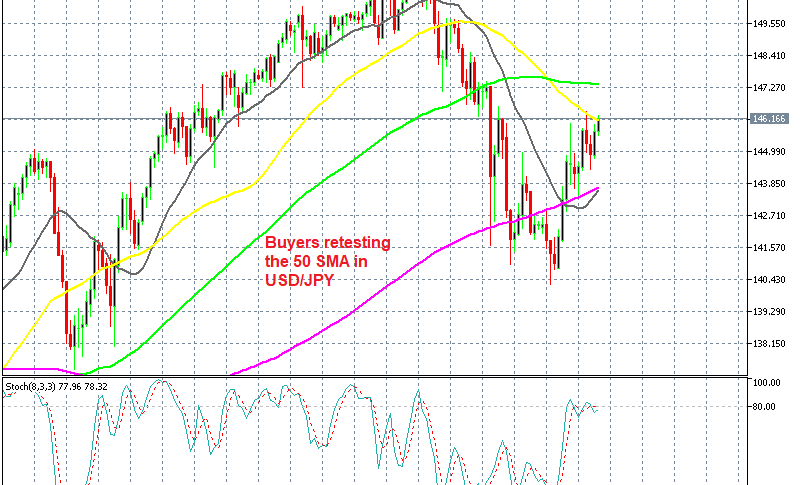
USD/JPY Daily Chart – Buyers Testing the 50 SMA for the Second Time

Softer wage growth is also contributing to the JPY weakness. The most recent wage figures, which the BoJ is looking at for the policy changes were pretty soft, showing a major decline. So, the JPY doesn’t have much going on for itself. However, this forex pair is facing the 50 SMA (yellow) on the daily chart, which rejected the price late last week after the US CPI inflation report, but returned back up yesterday, so let’s see if buyers have enough stamina to push the price above it.
Early this morning we had the PPI (Producer Price Index) inflation from Japan, which was expected to decline by 0.3% in December, adding further to the worries of lower inflation for JPY buyers. However, it remained flat at 0.0%, while monthly CPI increased by 0.3% instead.
December PPI Inflation Report from Japan
Month-over-Month (MoM) Comparison:
- December PPI MoM increased by 0.3%, exceeding expectations of 0.0%.
- In November, the PPI MoM was +0.2%.
Year-over-Year (YoY) Comparison:
- December PPI YoY remained unchanged at 0.0%, contrary to the expected decrease of -0.3%.
- In November, the PPI YoY was +0.3%.
USD/JPY Live Chart
- Check out our free forex signals
- Follow the top economic events on FX Leaders economic calendar
- Trade better, discover more Forex Trading Strategies
- Open a FREE Trading Account