EUR/GBP Continues Rangebound Trading After UK Inflation Report
EUR/GBP turned lower in the first week of January after being bullish in December, but the decline stopped and this pair has been trading ab
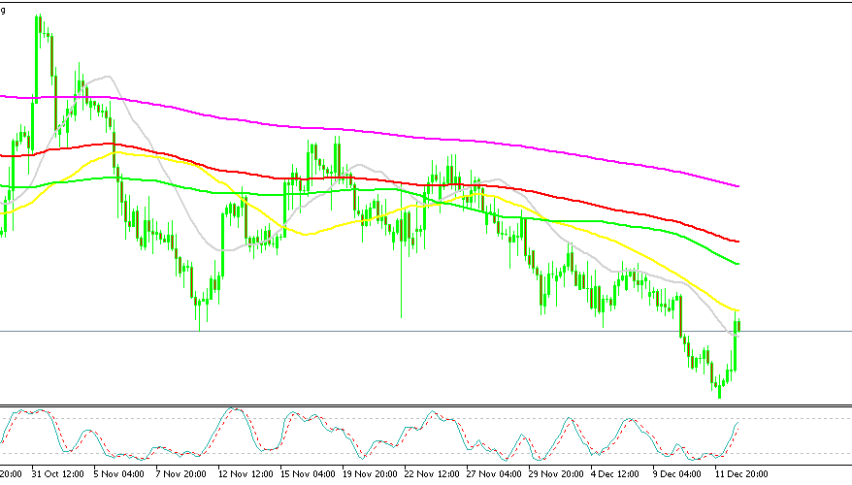
EUR/GBP turned lower in the first week of January after being bullish in December, but the decline stopped and this pair has been trading above and below 0.86 for more than a week. EUR/GBP has been trading in a range since Monday last week with neither side having the stamina to push things in any direction.
EUR/GBP H4 Chart – The 200 SMA Keeping the Price Beneath

Moving averages are acting as resistance on the H4 chart, which shows that the pressure remains on the downside on the larger picture, with the European Central Bank helping to keep the Euro in demand and this pair subdued. In the last two days, we have heard several ECB members making hawkish comments, trying to push back on rate cut expectations.
On the other hand, the economic data from the UK continues to show a further slowdown. Inflation has been declining quite fast in the UK as last month’s numbers showed and yesterday we saw that wage growth slowed considerably in the last three months. The average earnings index was expected at 6.8% in the three months to November but fell to 6.5% from 7.2% previously, while in August wages were growing by a pace of 8.5%.
Today’s inflation report for December was expected to show a slowdown of 0.1% from 3.9% in November, while core CPI was expected to lose 2 points and fall to 4.9% from 5.1% previously.
UK Consumer Price Index Report for November

- December CPI YoY +4.0% vs +3.8% expected
- November CPI YoY was +3.9%
- CPI MoM +0.4% vs +0.2% expected
- Prior CPI MoM -0.2%
- Core CPI YoY +5.1% vs +4.9% expected
- Prior CPI YoY +5.1%
- Core CPI +0.6% vs +0.4% m/m expected
- Prior -0.3%
EUR/GBP Live Chart
- Check out our free forex signals
- Follow the top economic events on FX Leaders economic calendar
- Trade better, discover more Forex Trading Strategies
- Open a FREE Trading Account