Forex Signals Brief January 29: The FED and BOE Continue the Central Banks Bonanza
Last week the ECB, BOJ and the BOE held their meeting with a dovish tilt, while this week we'll see if the FED and the BOE will sound dovish
Last week we had three central banks holding their scheduled meetings, however, there weren’t expectations for any rate cuts or even an announcement for future cuts. The Bank of Japan started the bank run on Tuesday, leaving rates at -0.10% and kept the dovish rhetoric, with the BOJ core CPI inflation ticking lower to 2.6%, giving them no reason to tighten the policy.
On Wednesday, the services and manufacturing PMI readings posted an improvement, particularly in the US, where the positive numbers kept coming from. The Q4 US GDP also came above expectations of 2.0%, showing a 3.3% expansion, while personal spending increased by 0.7%. That kept the USD in demand, however, most major pairs ended the week little changed.
Gold ended up around $20 lower, although there were many reversals during the week. Bank of Canada and the European Central Bank also kept rates unchanged, but the markets sensed a dovish tilt in both of them. The CorPCE price index moved lower on Friday, but the underlying components were more mixed than it seemed, which left traders uncertain at the end.
This Week’s Market Expectations
This week starts slowly, with the economic data being very light today, however, it picks up on Wednesday with a number of economic reports ahead of the FOMC meeting in the evening that day. As a result, the volatility is expected to remain under control until then. On Thursday, the Bank of England will take over and they’re anticipated to hold the status quo as well, but traders will be interested to see if there will be a dovish hint after the weak economic data from the Uk recently, which will sink the GBP.
Week Ahead 29 January – 4 February 2024
- Tuesday: Australian Retail Sales, Eurozone Q4 GDP, Spanish CPI, US JOLTS Job Openings, US Consumer Confidence.
- Wednesday: Australia CPI, Chinese Manufacturing and Non-Manufacturing PMIs, Switzerland Retail Sales, US ADP Employment, Canada GDP, FED Policy Decision.
- Thursday: China Caixin Manufacturing PMI, Eurozone CPI, Eurozone Unemployment Rate, BoE Policy Decision, US Jobless Claims, US ISM Manufacturing PMI.
- Friday: Australia PPI, US NFP. Report, US Revised UoM Consumer Sentiment


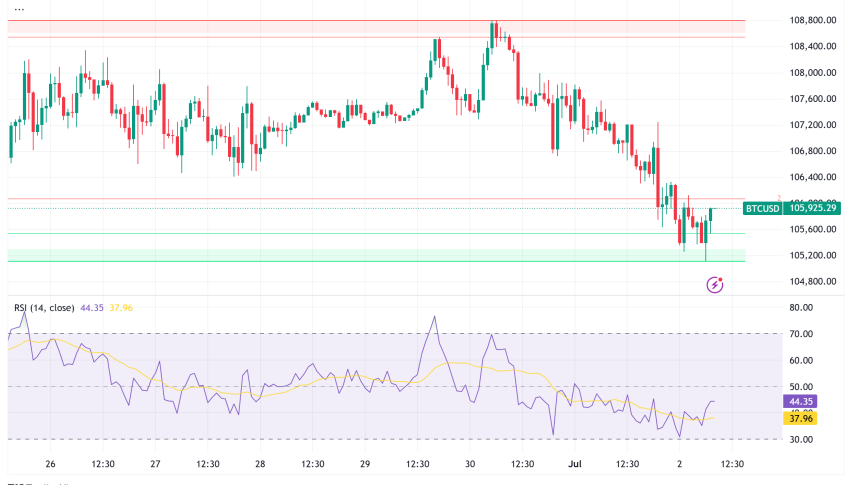
BTC/USD – Daily Chart
Ethereum Can’t Hold Above $2,300
ETHEREUM has also been negative after falling from above $2,700 following the launch of BTC ETFs, while the overall trend remains positive because it has not made lower lows yet. The price went below the 20 daily SMA (gray) yesterday, but it is still above the 50 SMA (yellow), which serves as the ultimate support indication during deeper pullbacks like this one. We’re trying to establish another long-term buy ETH signal at the 50 SMA, but we’ll see how the price action plays out.
Ethereum – Daily Chart
- ETH Buy Signal
- Entry Price: $2,290
- Stop Loss: $2,590
- Take Profit: $1,750
- Check out our free forex signals
- Follow the top economic events on FX Leaders economic calendar
- Trade better, discover more Forex Trading Strategies
- Open a FREE Trading Account