Abort Buy Gold Positions If the 50 SMA breaks – Gold Technical Analysis
Gold has been finding solid demand in recent months, however, the price action in recent weeks has become very volatile, with Gold sellers..
Gold has been finding solid demand in recent months, however, the price action in recent weeks has become very volatile, with massive swings. However, at the moment, Gold sellers remain in charge after strong US data, which is keeping the USD in demand, sending the Gold price toward the $2,000 level.
Gold has been on a strong bullish trend since early October, as geopolitical tensions remain high in the Middle East, keeping risk sentiment subdued somewhat, which helps safe havens remain in demand. As a result, Gold printed a new record high in early December at around $2,140, although the high price back then is different for different brokers.
Gold Daily Chart – The 50 SMA Is Under Threat

Gold is not making higher highs for more than two months
On the daily chart Gold has been helped by moving averages which have been acting as supporot, wiht the 200 SMA (purple) holding during pullbacks in November, then the 50 SMA (yellow) took over as support in January. However, th price hasn’t been able to make higher highs since early December, which is a sign that buyers are exhausted and we are close to a top.
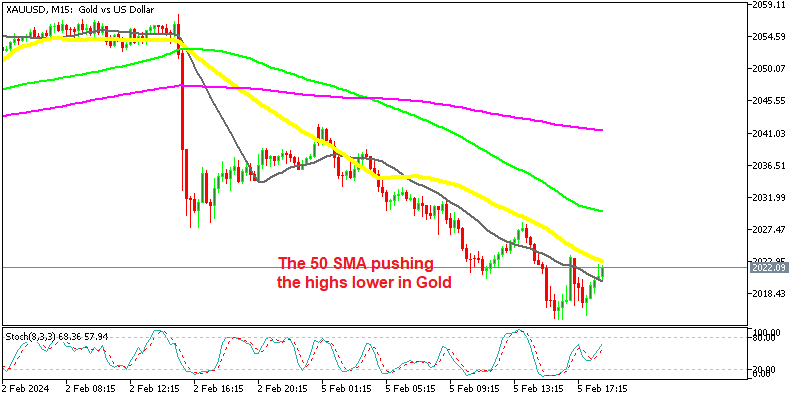
Gold buyers haven’t been able to push the price above the $2,100 level since then, despit emaking higher lows. Besides that, the price is returning to the 50 SMA too often, which indictes that it will likely break soon, and now it’s the right time after a great GDP report two weeks ago and two amazing jobs reports (JOLTS and NFP) last week.
Having said that, Gold is approaching a major swing point which held as support at the end of January. That level comes at around $2010 with a $1 range above and below A fall below that level would open the door for $2001.60 which has been the lowest level in 2024, followed by the major round support level at $2000.
Gold XAU Live Chart
- Check out our free forex signals
- Follow the top economic events on FX Leaders economic calendar
- Trade better, discover more Forex Trading Strategies
- Open a FREE Trading Account