Forex Signals Brief Feb 6: The RBA Holds Rates With A Hawkish Tilt
Yesterday the day was quiet, while today we have the RBA (Reserve Bank of Australia) meeting and New Zealand employment figures


Despite a decline in the late US trading session, the USD finished the day as the strongest of the major currencies yesterday, with the GBP coming in last place. The US dollar’s gains were fueled by the realization that the FED is unlikely to decrease rates before May, as Powell reaffirmed during his 60 Minutes interview over the weekend.
Other Fed officials, like Kashkari and Gooslebee, bolstered that view yesterday with more hawkish remarks. The ISM nonmanufacturing PMI came in better than predicted. More concerning is that the price index increased to 64.0 points from 57.4 points last month. New orders were also higher at 55.0 points compared 52.8 points, while employment climbed back beyond 50 points to 50.5 points versus 43.8 points in the previous month.
Today’s Market Expectations
Today starts with the earnings and spending figures from Japan which is important given the BoJ’s sole focus on wage growth. The figures for December were poor, showing a decline to 0.2% vs. 1.5% prior. However, earnings were revised higher to 0.7% yesterday and for January they’re expected to pick up by 1.3% while spending is expected to improve as well from -2.9% to -2.0%. The attention remains on the spring wage negotiations and the easing in inflation might help to bring real wages into positive territory.
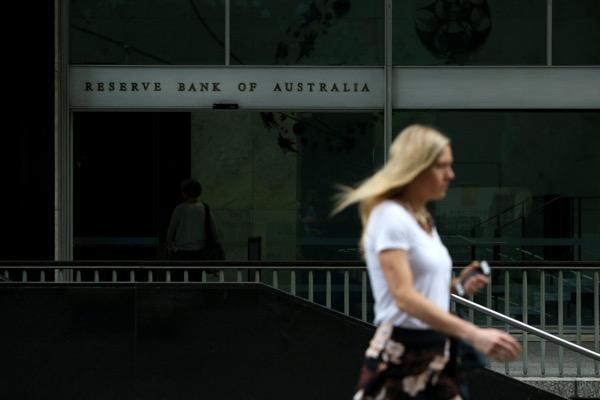
The RBA meeting took place early this morning, and they retained the Cash Rate at 4.35% as expected, with some minor changes to the statement to decrease the tightening tendency in response to softer labour market conditions and a widespread decline in inflation rates. They did say not to rule out further hikes, which the market interpreted as hawkish. The market expected the first rate decrease in August, but it was moved up to June following recent data announcements.
The employment report from New Zealand will be released at the end of the US session and is predicted to expand by 0.3% in Q4 compared to 0.2% in Q3, although the unemployment rate is expected to jump to 4.3% from 3.9% in Q3. Employment expenses are predicted to be lower, with the QoQ number ticking down to 0.8% from 0.9% in the previous quarter and the annualized number falling to 3.7% from 4.1% previously. The market expects the RBNZ to lower interest rates in May, and if the data is as predicted or worse, this becomes a serious possibility, which would weigh on the NZD.
Yesterday the USD advance continued further, with most major pairs breaking support levels and a reversal toward the end of the day, which caught us on the wrong side. However, we closed the day at breakeven with three winning and three losing forex signals, out of 7 that we opened in total, while one remained open.
Will the 50 SMA Break in Gold?
GOLD has been helped by moving averages which have been acting as support, with the 200 SMA (purple) holding during pullbacks in November, and then the 50 SMA (yellow) taking over as support in January. However, the price hasn’t been able to make higher highs since early December, which is a sign that buyers are exhausted and we are close to the top. Now Gold is approaching the support level from January. That level comes at around $,2010 with. A fall below that level would open the door for the major round support level at $2,000.
XAU/USD – Daily chart
EUR/USD Heading for 1.07
While EUR/USD is making a downward break of the major support zone around 1.08 and is heading for 1.07 pretty fast, after losing almost 200 pips since Friday when this pair was trading close to 1.09. We have turned bearish on EUR/USD after such a steep reversal, with the 20 SMA (gray) acting as support on the H1 chart.
USD/CAD – 240 minute chart
Cryptocurrency Update
Bitcoin Consolidating between 2 MAs
BITCOIN plummeted before reaching $50,000, losing more than $10,000 when the SEC approved the BTC ETF in early January. Sellers drove BTC below the 50 SMA (yellow) on the H4 chart, and the downtrend persisted until the price below $40,000. However, the 100 SMA (green) offered support, resulting in a comeback late last week. However, the 50 SMA acted as resistance, preventing the rise.
BTC/USD – Daily Chart
Ethereum Trading Below $2,300
ETHEREUM has also been bouncing in a range, sliding from above $2,700 since the debut of BTC ETFs, although the general trend remains favorable because it has yet to reach lower lows. The price fell below the 20 daily SMA (gray) yesterday, but it remains above the 50 SMA (yellow), which serves as the last support indicator during deeper pullbacks such as this one. We’re trying to develop another long-term buy ETH signal near the 50 SMA, but we’ll see how the price action unfolds.
Ethereum – Daily Chart
- ETH Buy Signal
- Entry Price: $2,290
- Stop Loss: $2,590
- Take Profit: $1,750
- Check out our free forex signals
- Follow the top economic events on FX Leaders economic calendar
- Trade better, discover more Forex Trading Strategies
- Open a FREE Trading Account