Forex Signals Brief Feb 7: Will FOMC Members Push A Hawkish Rhetoric?
Today there's not much on the economic calendar, besides some FED speakers which will likely repeat the higher-for-longer stance


Yesterday markets were slow, with not much on the economic calendar. The USD retraced some of the gains it had mafe in the previous two trading days, with Gold increasing to $2,038, where it found resistance at the MA, which had been acting as support before. The low at 1.0720s held again in EUR/USD after a second test in the Asian session and later in the day this pair climbed to 1.0750s, but the bullish momentum seemed weak, which shows that the downside is favourable at the moment.
Treasury yields began to rectify some of the gains they made in the last few days, with the 10-year yield moving a low of 4.079%, as the US Treasury successfully auctioned its first coupon of the week, the three-year note. That auction featured -0.8 basis points and saw high foreign demand, but that didn’t help the USD which ended the day as the weakest currency.
Cleveland Fed President Loretta Mester shared her perspective too, aligning with Chair Powell’s talking points. Mester argues that monetary policy is in a good place to assess the future moves in interest rates. She hinted at the prospect of lowering interest rates later this year if the economy improves as expected, though any rate cuts would most likely be modest.
Today’s Market Expectations
Today starts with the CPI report from China. The PBoC recently cut the RRR by 50 basis points, which was more than markets had expected, but traders appear to want more. The Chinese headline inflation YoY is expected to be -0.5% vs. -0.3% prior, while the MoM number for January is expected to increase to 0.4% vs. 0.1% in December. There is no consensus for the Core CPI YoY, though the prior figure showed a 0.6% rise, which was the same as for the previous two months.
In the afternoon, we have the Unemployment Claims figures from the US remain one of the most essential releases each week since it provides a more timely signal of the status of the labor market. Initial Claims continue to remain near cycle lows, albeit climbing in the previous two weeks, while Continuing Claims have resumed their upward trend and are now approaching the cycle high. This week’s consensus is for Initial Claims to be 220K, up from 224K the previous week, but there is no consensus for Continuing Claims, however, the previous report showed an increase to 1898K from 1828K.
Yesterday the price action in most forex pairs was slow so we only had three closed trading signals. The USD retreated lower after advancing in the previous two days, but we used this opportunity to go long on the Buck. We ended up with two winning forex signals and a losing signal at the end of the day.
Bullish Move Stopps at the 200 SMA for Gold
Gold fell $50 in the previous two days as USD sentiment improved following the hawkish FOMC and strong NFP employment data last week. However, geopolitical tensions in the Middle East remain high, increasing the demand for safe havens. As a result, gold continues to trade over $2,000, and all attempts to restore it to this level have been unsuccessful. Yesterday, they returned, raising the price closer to $2,040, but the 200 SMA stopped the climb.
XAU/USD – 240 minute chart
USD/CAD Fails at the 200 SMA
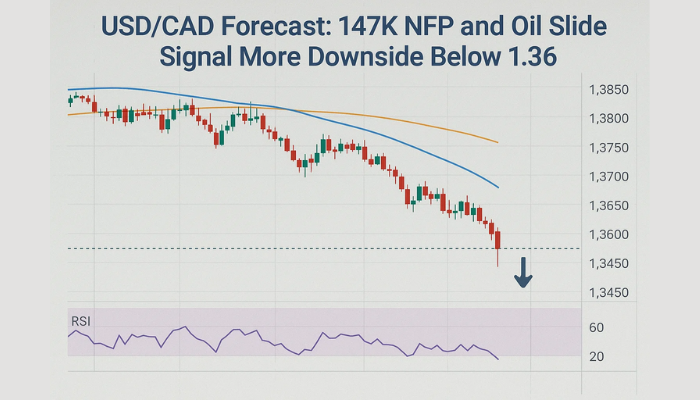
USD/CAD broke over the 200-day SMA on Tuesday, which served as support twice in January. The price continued at its highs for the year, but it is now approaching the 100-day moving average, which stopped the climb and yesterday’s daily candlestick closed as a doji, which is a bearish reversing sign. The economic news from Canada was mixed, with the housing industry indicating significant challenges.
USD/CAD – 240 minute chart
Cryptocurrency Update
Bitcoin Sticks to the 50 SMA
BITCOIN is showing a willingness to make a bullish break as it keeps knocking at the 50 daily SMA. BTC/USD fell before reaching $50,000, dropping more than $10,000 when the SEC authorized the BTC ETF in early January. Sellers pushed BTC below the 50 SMA (yellow) on the H4 chart, and the slump continued until the price fell below $40,000. However, the 100 SMA (green) provided support, prompting a rebound late last week. However, the 50 SMA is functioning as resistance, halting the increase.
BTC/USD – Daily Chart
Ethereum Stuck Between 2 MAs
ETHEREUM has also been bouncing in a range, falling from over $2,700 since the launch of BTC ETFs, but the overall trend remains positive because it has yet to reach lower lows. The price went below the 20 daily SMA (grey) yesterday, but it is still above the 50 SMA (yellow), which acts as the last support indication during deeper pullbacks like this one. We’re aiming to construct another long-term buy ETH signal near the 50 SMA, but we’ll see how the price movement plays out.
Ethereum – Daily Chart
- ETH Buy Signal
- Entry Price: $2,290
- Stop Loss: $2,590
- Take Profit: $1,750
- Check out our free forex signals
- Follow the top economic events on FX Leaders economic calendar
- Trade better, discover more Forex Trading Strategies
- Open a FREE Trading Account


