WTI Stalls at MAs After Major EIA Crude Oil Inventory Buildup
Oil prices were on the way for the third day of gains as WTI crude Oil pushed above $74. But, the EIA Crude Oil inventory showed a buildup


Oil prices made a bullish reversal on Monday and today they were on the way for the third day of gains in a row as WTI crude pushed above $74 earlier today. But, buyers ran into the 200 SMA and the EIA Crude Oil inventory showed a considerable buildup. So, Oil is looking overbought now and a bearish reversing chart pattern is forming, indicating that the price might resume the decline from last week.
However, the U.S. crude Oil output is anticipated to expand less than initially predicted, allaying concerns about market oversupply. The EIA report showed a significant build in crude Oil inventories, but gasoline and distillates experienced drawdowns. Additionally, there was an increase in crude production, but refining utilization declined unexpectedly.
WTI Crude Oil Chart H4 – The 200 SMA Stops the Bullish Momentum
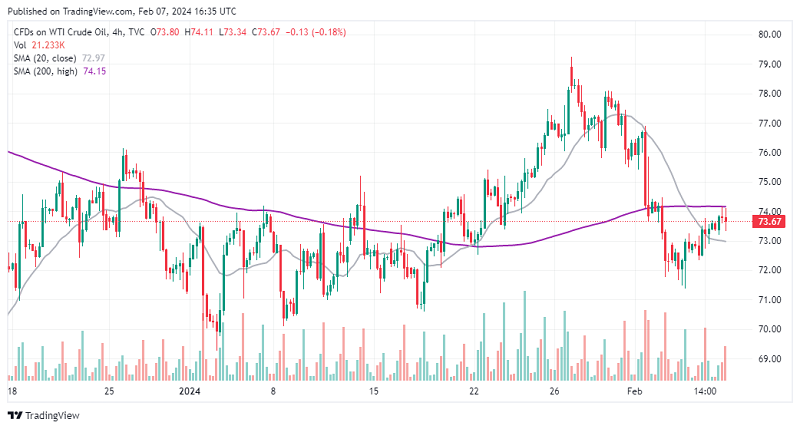
US WTI found resistance at the 200 SMA on the H4 chart, forming a doji candlestick that signals a reversal after the bullish move. The current H4 candlestick looks bullish already, so the reversal is underway. We are thinking of opening a sell Oil signal, as the decline picks up pace.
Weekly EIA Crude Oil Inventory
- Crude Oil: Inventories increased by 5.521 million barrels, significantly higher than the expected build of 1.895 million barrels.
- Gasoline: Stocks showed a drawdown of -3.146 million barrels, contrasting with the expected build of 0.140 million barrels.
- Distillates: Experienced a drawdown of -3.221 million barrels, surpassing the expected drawdown of 1.000 million barrels.
- Cushing: Showed a drawdown of -0.033 million barrels, compared to a drawdown of 1.972 million barrels in the previous week.
- Crude Production: Increased by 13.3 million barrels, slightly higher than the previous week’s production of 13.0 million barrels.
- Refining Utilization: Decreased by -0.5%, in contrast to the expected increase of 4.0%. Last week, it decreased by -2.6%.
The EIA provides detailed analyses of refinery operations, and storage quantities for various types of crude oil such as light, medium, and heavy etc. So, the EIA’s conclusions are deemed more accurate and thorough than the API’s survey results which are shown below, and usually, the EIA report moves Oil prices. US inventories typically increase in the first quarter, but we haven’t seen a strong increase so far, apart from today’s report. Perhaps the pickup in the US economy has increased the demand for Oil or perhaps China is increasing the demand?
Weekly API Private US Oil Inventory from Yesterday
US WTI Crude Oil Live Chart
- Check out our free forex signals
- Follow the top economic events on FX Leaders economic calendar
- Trade better, discover more Forex Trading Strategies
- Open a FREE Trading Account
- Read our latest reviews on: Avatrade, Exness, HFM and XM
Related Articles


Sidebar rates
Related Posts
