Gold Price Forecast: XAU/USD Above $2010; Navigating Inflation Uncertainties and Global Tensions
As Monday's early Asian session witnessed, gold prices (XAU/USD) showcased resilience, climbing beyond the $2,010 threshold.

As Monday’s early Asian session witnessed, gold prices (XAU/USD) showcased resilience, climbing beyond the $2,010 threshold.
This upward momentum is largely due to the latest U.S. economic figures, which highlight ongoing high inflation, tempering expectations for a near-term Federal Reserve rate cut initially projected for June. Presently, gold stands at $2,014, experiencing a slight uptick of 0.12%.
Economic Indicators and Gold Price Dynamics
The beginning of the year saw the Producer Price Index (PPI) for final demand ascend by 0.3% month-on-month, marking a reversal from December’s 0.1% decline and recording the most significant rise since August 2023.
On a yearly basis, the PPI saw a 0.9% increase, marginally beneath the 1.0% gain seen previously. Simultaneously, U.S. housing starts took a notable dive of 14.8%, dropping to 1.331 million, coupled with a 1.5% decrease in building permits.
Speculation about the Federal Reserve’s rate cut timeline persists, though chances of a June adjustment seem to be diminishing.
Such a delay could unfavorably affect gold, as elevated interest rates diminish the appeal of non-yielding assets like gold, making yield-bearing investments more attractive.
Global Economic Outlook and Gold
Internationally, the People’s Bank of China (PBOC) is poised to announce its interest rate decision soon, with no change anticipated by analysts. The financial community is also closely watching for further stimulus measures from Chinese officials in the near term.
Moreover, rising geopolitical tensions in the Middle East, particularly Hezbollah’s solidarity actions with Gaza allies Hamas and their ongoing response to Israeli activities in Gaza, could bolster gold’s appeal as a safe-haven asset.
As anticipation builds for the PBOC’s interest rate decision and the release of the FOMC Minutes, market participants are ready to assess these events’ implications on gold prices, looking for trading opportunities in this fluctuating environment.
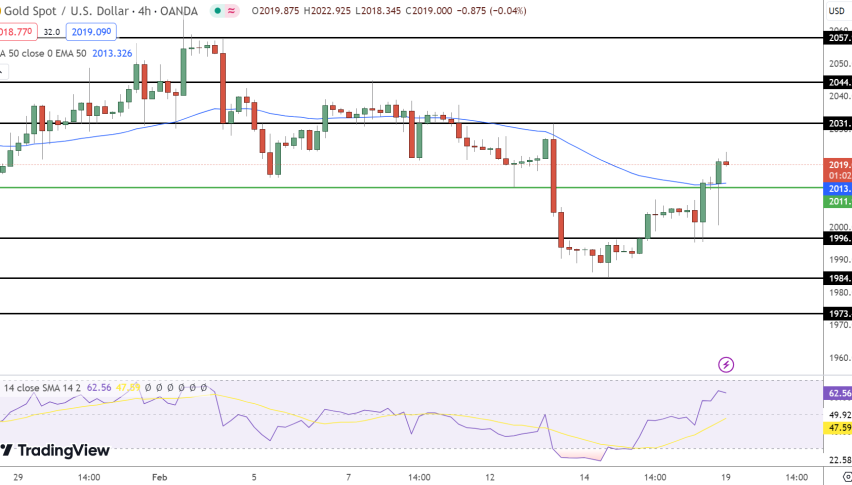
Gold Technical Outlook
Gold’s current trading price of $2019, reflecting a 0.27% gain, positions it in a bullish domain above the pivot point of $2011.96. Resistance levels are identified at $2031.74, $2044.26, and $2057.94, with support at $1996.54, $1984.38, and $1973.46.
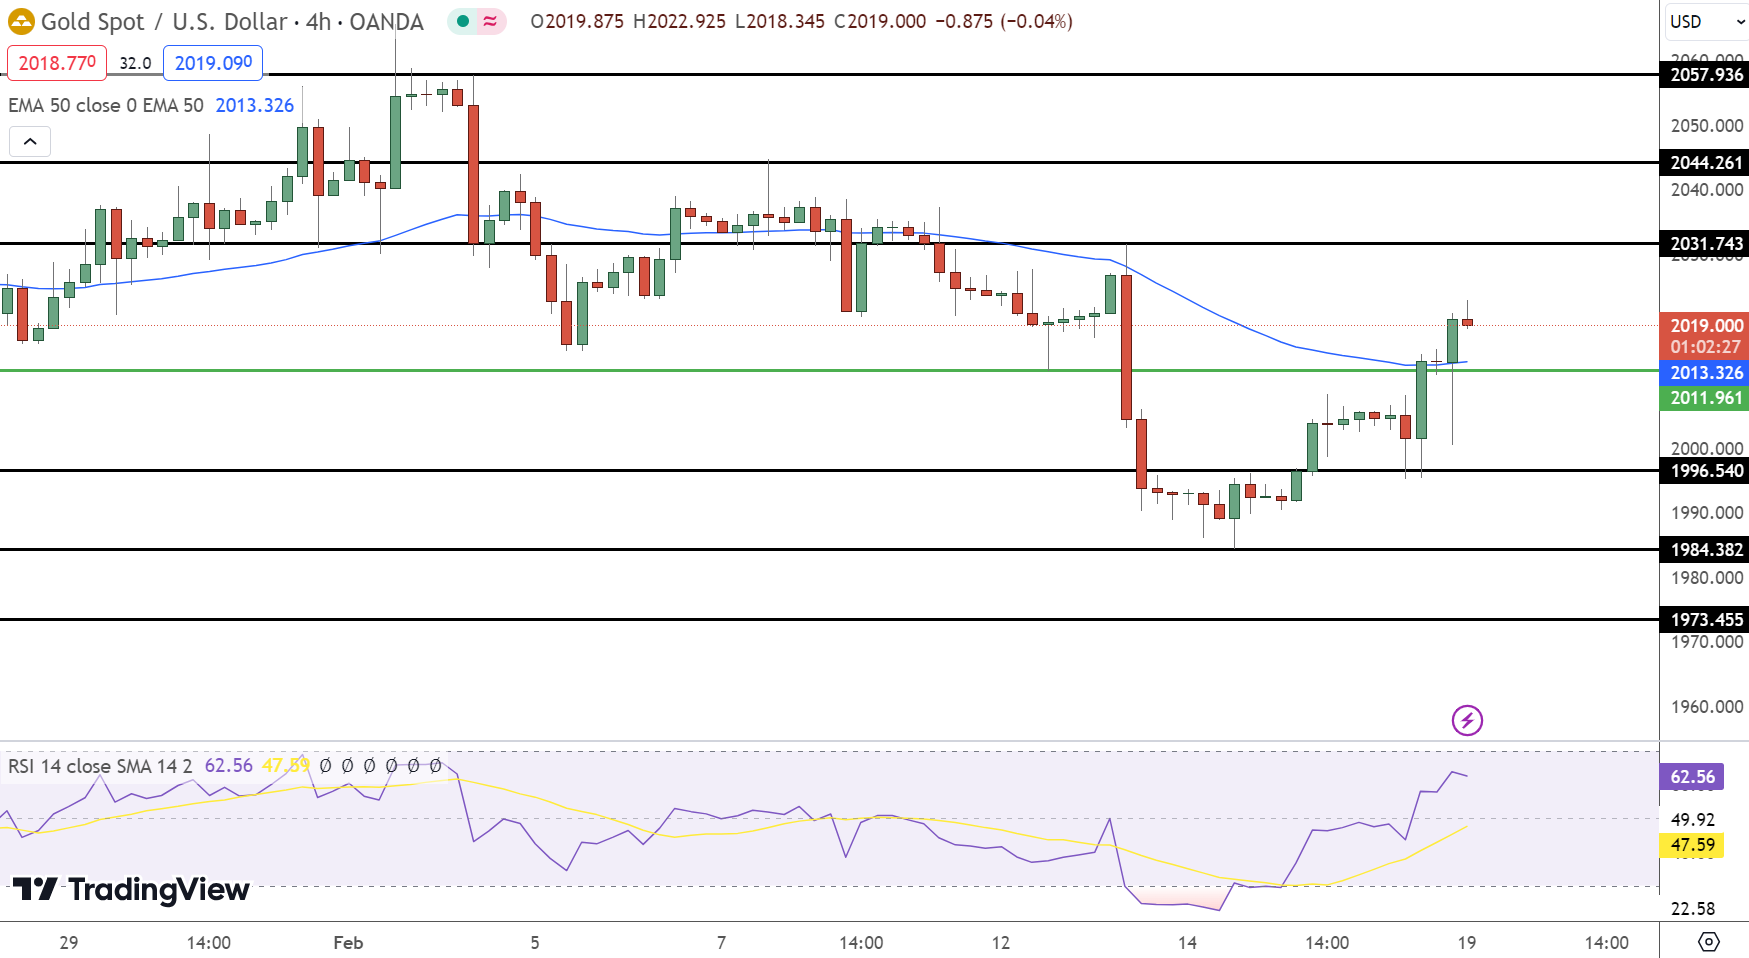
The Relative Strength Index (RSI) at 62 signals potential for further advances, supported by the 50-Day Exponential Moving Average (EMA) at $2013.33, which bolsters the bullish outlook as long as gold’s price hovers above the pivot.
Investors are advised to monitor these pivotal levels and technical indicators closely, considering them for potential market entry or exit strategies amidst the ongoing bullish trend above $2011.96.
Gold XAU Live Chart
- Check out our free forex signals
- Follow the top economic events on FX Leaders economic calendar
- Trade better, discover more Forex Trading Strategies
- Open a FREE Trading Account


