Gold Price Rebound Stops at the 50 Daily SMA
Gold has rebounded off the 100 SMA last week reaching $2,031 but the climb stopped at the 50 daily SMA
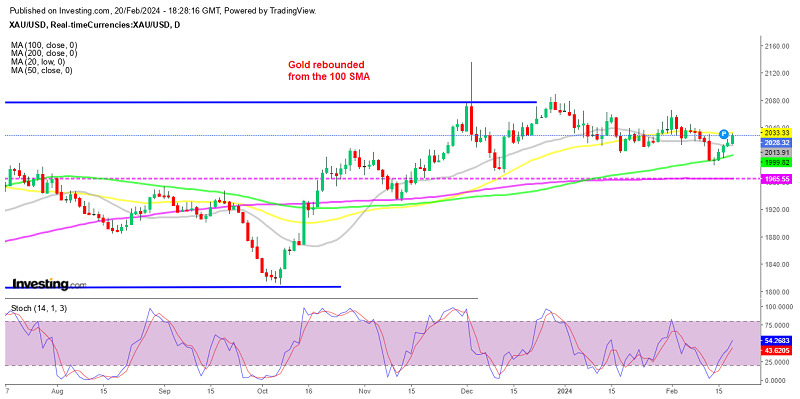

Gold has been experiencing a rebound for about a week, reaching $2,031 a while ago, after erasing the $40 tumble following the US CPI inflation report last Tuesday. Last week’s recovery was supported by purchasers defending the 100 SMA on the daily chart, leading to a surge back above the $2,000 level.
Despite some technical concerns, such as the emergence of a pattern indicating lower highs and lower lowssince late December, Gold continues to find demand below the $2,000 level, with the 100 daily SMA (green) acting as support amid fluctuations in market expectations regarding FED rate cuts.
The daily chat above may show resistance near the $2,055-60 trendline barrier, but before that Goldbuyers are facing the 50 SMA (yellow) which is limiting upward momentum for the time being. However, price hasn’t retreated too much from the 50 SMA and the daily candlestick is looking bullish.
Despite that, the overall resilience of Gold amid market volatility suggests a positive outlook for the precious metal. So, chances are that we might see a break of the 50 daily SMA tomorrow. Otherwise, we will open a long term sell Gold signal id buyers fail to break the 50 SMA tomorrow and we will target the 100 SMA at the bottom.
Gold Live Chart XAU
- Check out our free forex signals
- Follow the top economic events on FX Leaders economic calendar
- Trade better, discover more Forex Trading Strategies
- Open a FREE Trading Account
- Read our latest reviews on: Avatrade, Exness, HFM and XM
Related Articles


Sidebar rates
Related Posts
