Euro Forms Bearish Reversing Chart Pattern
The Euro to Dollar exchange rate increased early last week, but then the price reversed, forming a bearish reversal chart pattern for EURUSD
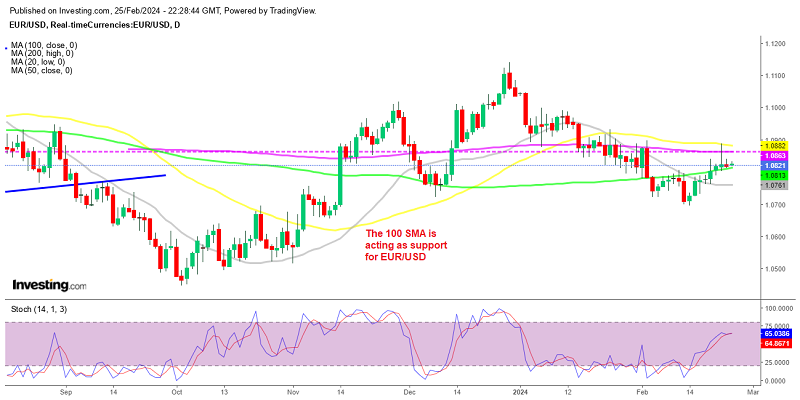
The Euro to Dollar exchange rate experienced and increase in the first half of the week, but then the price traded within a 70 pip range. However, at the end of the week, EURUSD tried the upside, failed at the 50 SMA and ended up back down, forming a bearish chart pattern on the daily and the weekly timeframes.
EUR/USD Daily Chart – The 50 SMA Acted As Resistance
In fact, last week’s trading activity in the currency markets was relatively subdued due to a lack of economic data to induce volatility, particularly in the second. On Friday we saw a rally to the upside, after some USD selling, but ECB members also helped somewhat with their comments.
ECB Tries to Push Back on Rate Cut Expectations
Muller’s stance during his speech suggested a cautious approach, preferring to assess Q1 salary statistics before making decisions on interest rates. He said that acting prematurely could lead to the need for corrections later on, indicating a preference for patience and careful consideration. Despite expectations of modest European GDP growth around 0.5% this year, Muller and possibly the ECB as a whole appear hesitant to cut rates too soon. Now the market anticipates the first rate cut to come in June at the earlierst, which gave some support to the Euro.
Later on the Bundesbank leader and ECB member Nagel also joined in, underscoring the importance of making monetary policy decisions based on data rather than simply following the actions of other central banks. This suggests a cautious and data-driven approach to monetary policy, prioritizing economic indicators before delivering the first cut. It’s notable that markets have priced in expectations of 90 basis points of ECB rate cuts by the end of the year, a figure that closely aligns with the anticipated moves by the Federal Reserve.
Such a degree of monetary easing is driven by concerns about economic growth, inflation, or other factors. However, Nagel’s comments suggest that the ECB may not necessarily follow this path if the data does not support such actions. Overall, these remarks signal a commitment to independent decision-making by the ECB, guided by the economic realities of the Eurozone rather than market expectations.
This supported the Euro during the European session, but but buyers ran into the 50 SMA (yellow) which acted as resistance on the daily chart and the price retreated lower in the US session, forming another doji candlestick, which suggests a reversal after the retrace higher. This formed a bearish reversing chart pattern, indicating that the EUR/USD price will likely head down below 1.07 this week. However, the 100 SMA (green) is acting as support, while traders are also cautious ahead of the CPI and PCE inflation reports later in the week, so we’ll see if sellers will prevail.
EUR/USD Live Chart
- Check out our free forex signals
- Follow the top economic events on FX Leaders economic calendar
- Trade better, discover more Forex Trading Strategies
- Open a FREE Trading Account
- Read our latest reviews on: Avatrade, Exness, HFM and XM
Related Articles


Sidebar rates
Related Posts
