Natural Gas Hits $1.778 Amid Geopolitical Tensions & Qatar’s Output Plans
Natural Gas (NG) witnessed a significant surge and started this new week on the bullish track, hitting the intra-day high of $1.756. However
Natural Gas (NG) witnessed a significant surge and started this new week on the bullish track, hitting the intra-day high of $1.756. However, the upward trajectory of NG has been influenced by several factors including escalating geopolitical tensions as the geopolitical tensions often boost Natural Gas (NG) prices due to concerns about supply disruptions.
Despite talks of a ceasefire between Israel and Palestine, the situation in Gaza continues to worsen due to intensified bombardments.
Additionally, military actions in Yemen by the US and the UK have contributed to geopolitical uncertainties, further bolstering NG prices.
In contrast to this, the uncertainty surrounding Federal Reserve rate cuts can dampen investor confidence, leading to lower demand for natural gas and consequently lower prices in the market.
Qatar Announces New Gas Output and Its Impact on Natural Gas (NG)
Qatar, a major LNG producer, plans to boost output from the world’s largest gas field. The North Field expansion project aims to increase LNG production to 142 million tonnes per year by 2030, adding 16 million tonnes annually. This could flood the global LNG market, potentially lowering natural gas prices due to oversupply.
Despite this, rising demand from Asian nations like China, Japan, and South Korea could balance prices over time. Qatar’s expansion could stabilize natural gas prices in the long run by meeting growing demand while increasing supply.
Therefore, Qatar’s plans to expand LNG production may exert downward pressure on Natural Gas (NG) prices due to increased global supply. However, growing demand from Asia could potentially stabilize prices in the long term.
US Fed Stance on Interest Rate Cut and Geopolitical Issues Impacting Natural Gas (NG)
Furthermore, the US Federal Reserve’s decisions on interest rates and geopolitical events like the Israel-Gaza war impact Natural Gas (NG) prices. The Fed is taking a careful approach to rate cuts, waiting for more data before deciding.
This affects market expectations, influencing NG prices. The uncertainty about when rate cuts might happen could cause NG prices to be volatile in the short term.
Geopolitical tensions, like the Israel-Gaza war, affect Natural Gas (NG) prices. The conflict could disrupt supply routes and influence market sentiment. Also, ongoing military actions in Yemen add to geopolitical uncertainties, causing NG prices to fluctuate.
Besides Fed policy and geopolitical concerns, upcoming US economic data, like the core PCE Price Index for January, will impact Natural Gas (NG) prices. Investors will watch these indicators closely to understand the US economy’s health and how it might affect NG demand.
Natural Gas (NG) Price Forecast: Technical Outlook
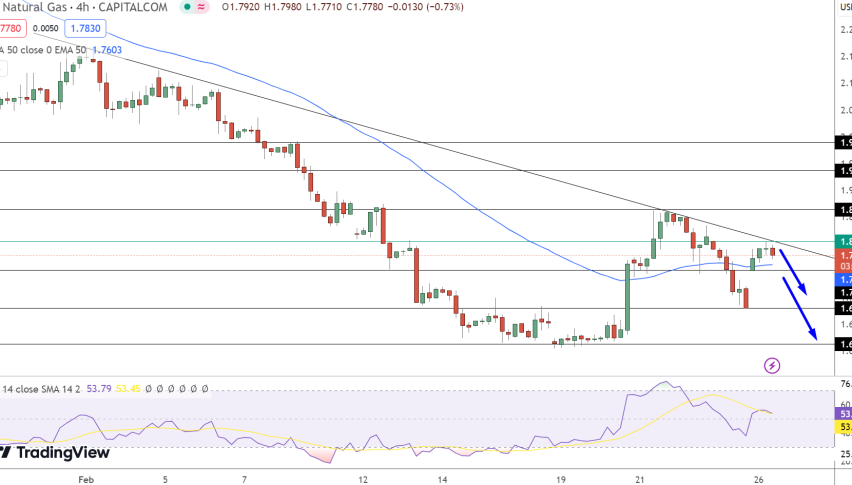
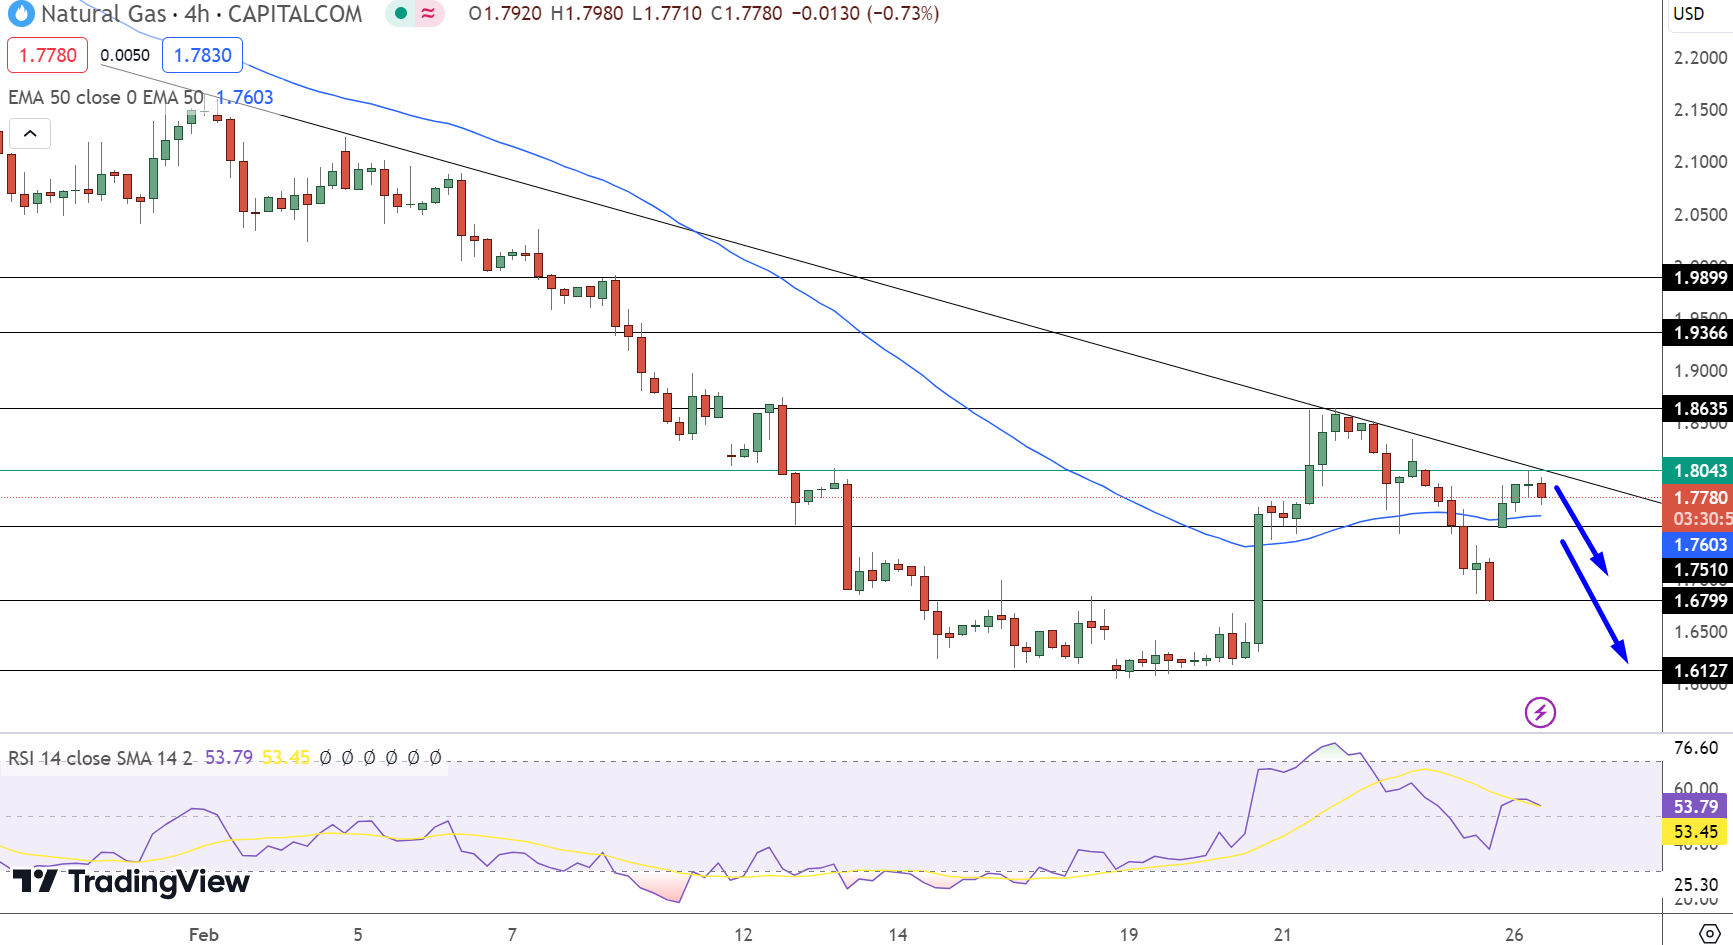
Natural Gas (NG) witnessed a notable uptick, climbing 5.83% to settle at $1.7780. This surge is particularly interesting, given the daily chart’s pivot point at $1.8043, which now serves as a critical benchmark for the commodity’s next movements.
Resistance levels are staggered upwards with immediate ceilings at $1.8635, $1.9366, and $1.9899, suggesting potential hurdles for further advances.
Conversely, support is established at $1.7510, followed by $1.6799 and $1.6127, marking zones where buyers might step in.
The Relative Strength Index (RSI) at 53 indicates a relatively balanced market momentum. However, the 50-Day Exponential Moving Average (EMA) at $1.7603 and a closing evening star candlestick pattern below the $1.804 resistance level hint at a potential shift towards a selling trend, suggesting a bearish outlook below $1.8043.
- Check out our free forex signals
- Follow the top economic events on FX Leaders economic calendar
- Trade better, discover more Forex Trading Strategies
- Open a FREE Trading Account
- Read our latest reviews on: Avatrade, Exness, HFM and XM
Related Articles
Sidebar rates
Related Posts
