The AUD Showing Weakness Against the USD Today
The technical analysis of the AUD/USD pair shows that the AUD to USD price action is displaying weakness as the new week begins.

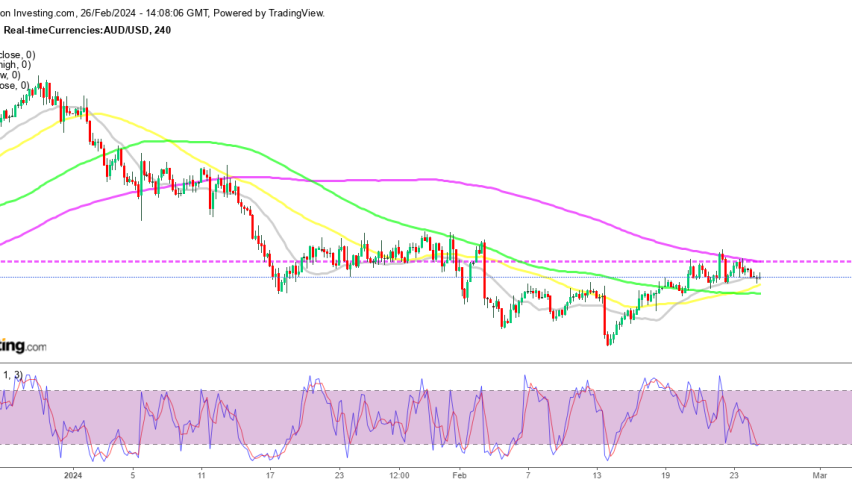
The technical analysis of the AUD/USD pair shows that the AUD to USD price action is displaying weakness as the new week begins. Despite limited catalysts for movement, the pair is holding slightly lower. Examination of the H4 chart below reveals that AUD/USD is experiencing a slide after multiple tests of the 200-day moving average (purple) since last week.
AUD/USD H4 Chart – The Highs Continue to Get Lower

Currently, the 200-day moving average is a significant technical level acting as a barrier to upward momentum, with sellers demonstrating increased aggressiveness. The pair’s decline now poses a threat to breaking the 100-day moving average (red line) at 0.6550, which is a key level to monitor ahead of the daily close.
Additionally, buyers have lost their upward momentum, as price action fell back below the 50-hour moving average (yellow), leading to a shift in the near-term bias to a more neutral stance. Traders now face a wider technical range between the 100-hour moving average (0.6558) and the current 200-hour moving average (blue line) at 0.6535.
Given the absence of significant risk events, the outlined technical aspects will play a crucial role in guiding AUD/USD price action at the start of the week, particularly considering potential month-end flows in the coming sessions. Traders and investors should closely monitor these technical levels to assess the pair’s short-term direction and make informed trading decisions.
AUD/USD Live Chart
- Check out our free forex signals
- Follow the top economic events on FX Leaders economic calendar
- Trade better, discover more Forex Trading Strategies
- Open a FREE Trading Account


