Crude Oil (USOIL) Peaks Over $79; Inventory Surge and OPEC Cuts Stir Markets
West Texas Intermediate (WTI) U.S. crude oil saw an uptick, briefly surpassing $79 before a surprising increase in U.S. crude oil
West Texas Intermediate (WTI) U.S. crude oil saw an uptick, briefly surpassing $79 before a surprising increase in U.S. crude oil inventories exerted downward pressure. The Energy Information Administration (EIA) reported a rise in stocks, notably surpassing forecasts with a 4.199 million barrel increase for the week ending February 23, outpacing the anticipated 2.743 million.
The American Petroleum Institute (API) reported that this came after a sizable increase in inventory, which heightened supply concerns.
OPEC’s Strategic Adjustments
In response to escalating inventories, the Organization of the Petroleum Exporting Countries (OPEC) has maintained production caps until June, contemplating further cuts through the next quarter.
OPEC aims to stabilize prices by mitigating the influx of crude oil, particularly from the U.S., which has emerged as a major exporter to Europe. These measures underscore efforts to balance supply with cautious demand forecasts.
Pricing Trends and Economic Indicators
Due to the increase in inventory and the potential impact of sustained high U.S. interest rates on demand, oil prices declined in subsequent sessions. Brent Crude adjusted slightly, while WTI Crude experienced a minor dip.
The continuous inventory growth highlights concerns over demand elasticity and economic vitality. Analysts now focus on upcoming U.S. economic data, including the personal consumption expenditures price index, for further market direction.
Amidst these developments, OPEC+ deliberates extending voluntary output reductions to stabilize the market. Analyst projections remain steady, anticipating Brent and WTI to average around $86 and $81 per barrel in 2024, respectively.
Nonetheless, geopolitical tensions continue to underpin market stability, with unfolding events in the Middle East poised to influence oil price trajectories.
USOIL Price Forecast: Technical Outlook
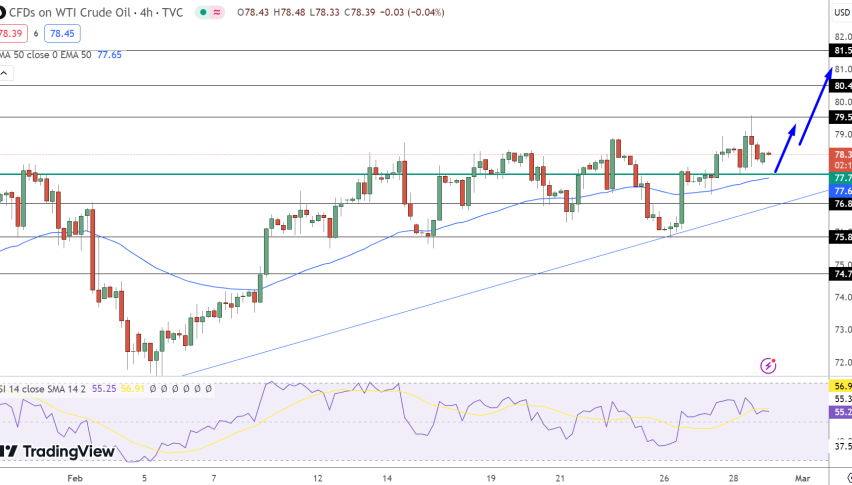
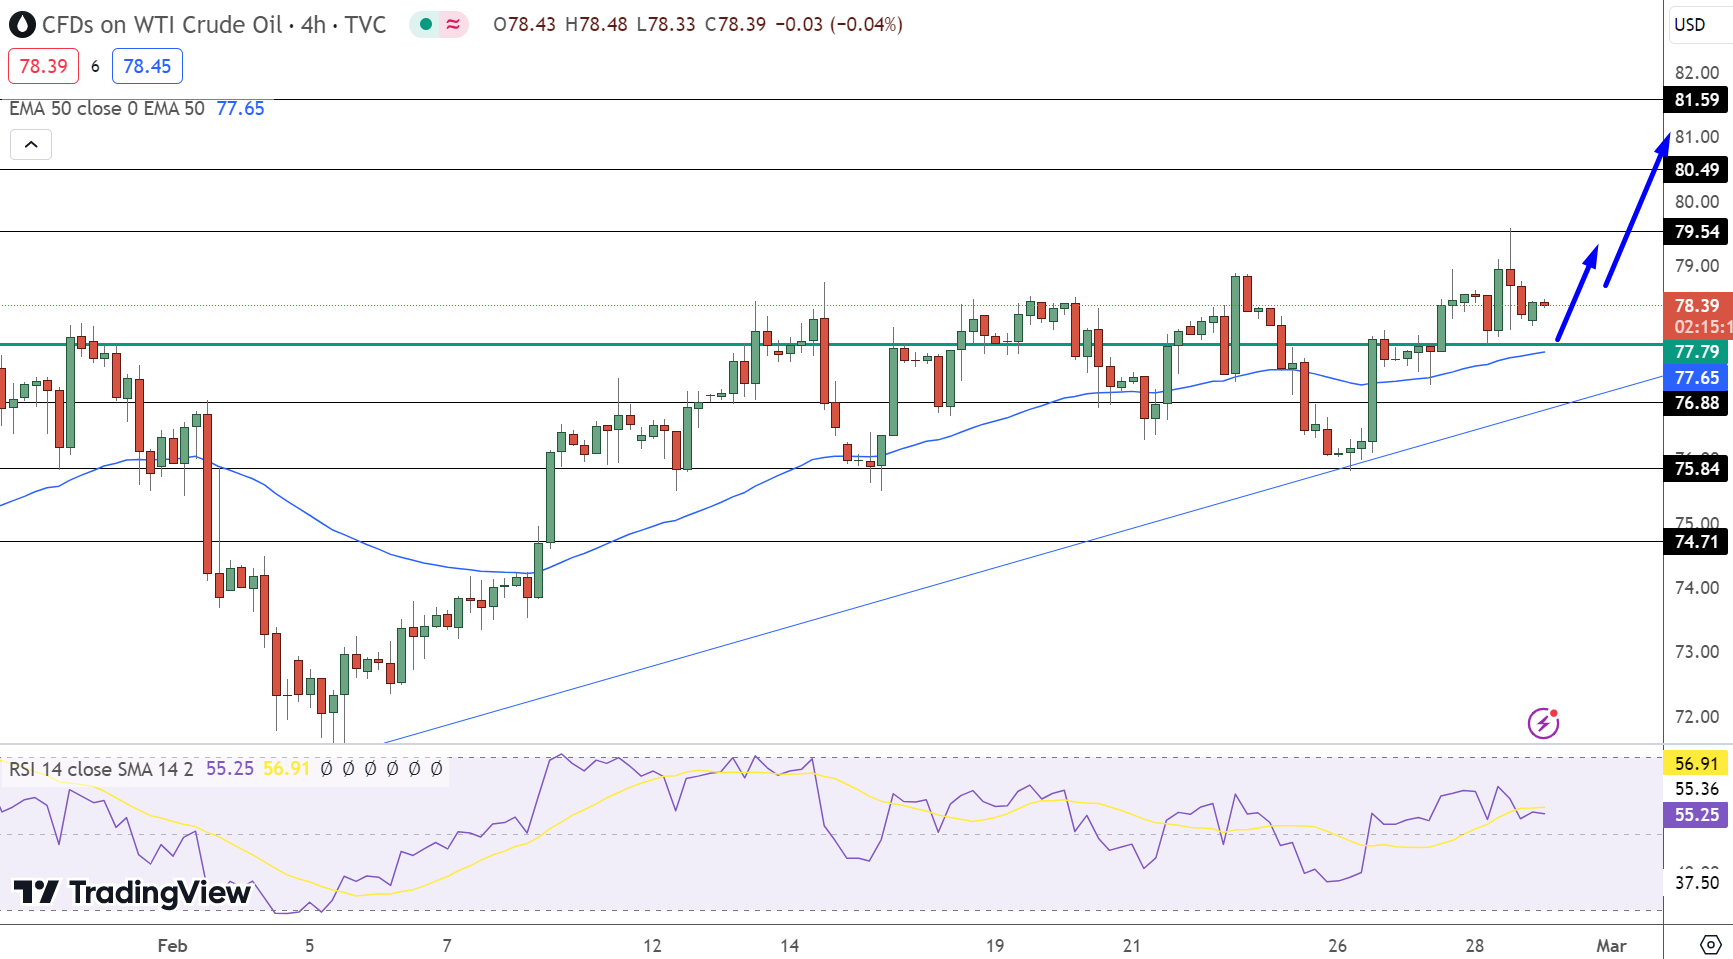
USOIL has shown a modest increase, currently trading at $78.44, marking a 0.31% rise. The pivot point for today is set at $78.88. Looking at resistance, USOIL faces its first challenge at $79.61, with subsequent levels at $80.36 and $81.06.
Support levels are identified at $77.46, $76.25, and $75.17, providing potential areas of buying interest. The Relative Strength Index (RSI) stands at 55, indicating neither overbought nor oversold conditions.
The 50-day Exponential Moving Average (EMA) is at $77.65, suggesting the price has bullish support. Given these indicators, the overall trend for USOIL appears bullish above $77.65, indicating room for further upside if this support level holds firm.
- Check out our free forex signals
- Follow the top economic events on FX Leaders economic calendar
- Trade better, discover more Forex Trading Strategies
- Open a FREE Trading Account
- Read our latest reviews on: Avatrade, Exness, HFM and XM
Related Articles


Sidebar rates
Related Posts
