Crude Oil (USOIL) Price Forecast: Fed Rates & 4.2M Barrel Rise Influence $78.54 Dip
The Federal Reserve's decision to maintain current interest rates, combined with an increase in U.S. crude stockpiles, exerted additional
•
Last updated: Friday, March 1, 2024
The Federal Reserve’s decision to maintain current interest rates, combined with an increase in U.S. crude stockpiles, exerted additional downward pressure on U.S. crude oil futures.
Brent crude marginally rose by 0.04% to $83.68 a barrel, while West Texas Intermediate (WTI) futures saw a decrease of 0.42%, settling at $78.54 a barrel.
The Energy Information Administration (EIA) reported that U.S. crude inventories increased by 4.2 million barrels last week, outpacing expectations of 2.74 million barrels, which led to this price movement.
Inventory Impact and Refinery Rates
The continuous rise in stockpiles, attributed to unexpected refinery shutdowns and planned maintenance, along with a slight increase in refinery utilization rates, remains below the decade’s average.
The extended period of reduced refinery activity, particularly noted with the ongoing outage at BP’s Whiting refinery, has notably impacted fuel stock levels.
Market Dynamics and OPEC+ Strategy
Despite these domestic challenges, the market received some support from OPEC+ deliberations on extending oil output cuts and ongoing Middle East tensions. Nonetheless, the Federal Reserve’s stance on interest rates, emphasizing a cautious approach to inflation control, suggests potential headwinds for oil demand.
This complex interplay of refinery capacities, geopolitical developments, and monetary policy signals a nuanced outlook for the crude oil (USOIL) price forecast, emphasizing the need for market participants to remain vigilant to both economic indicators and geopolitical events.
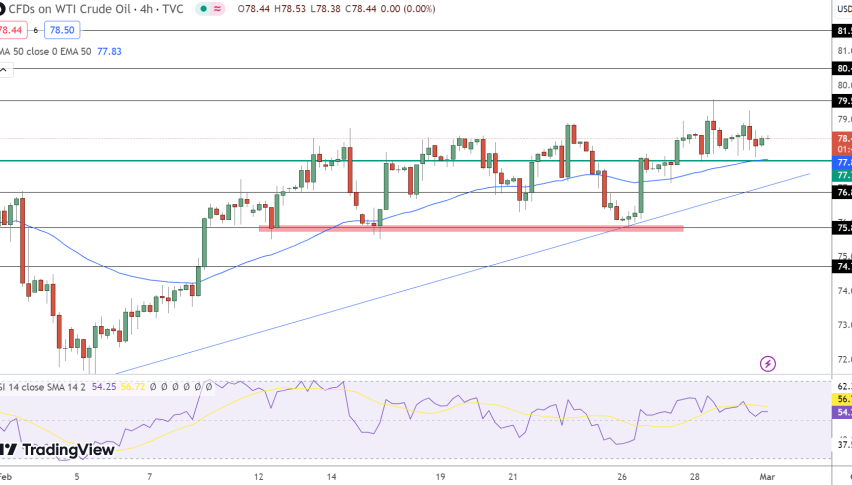
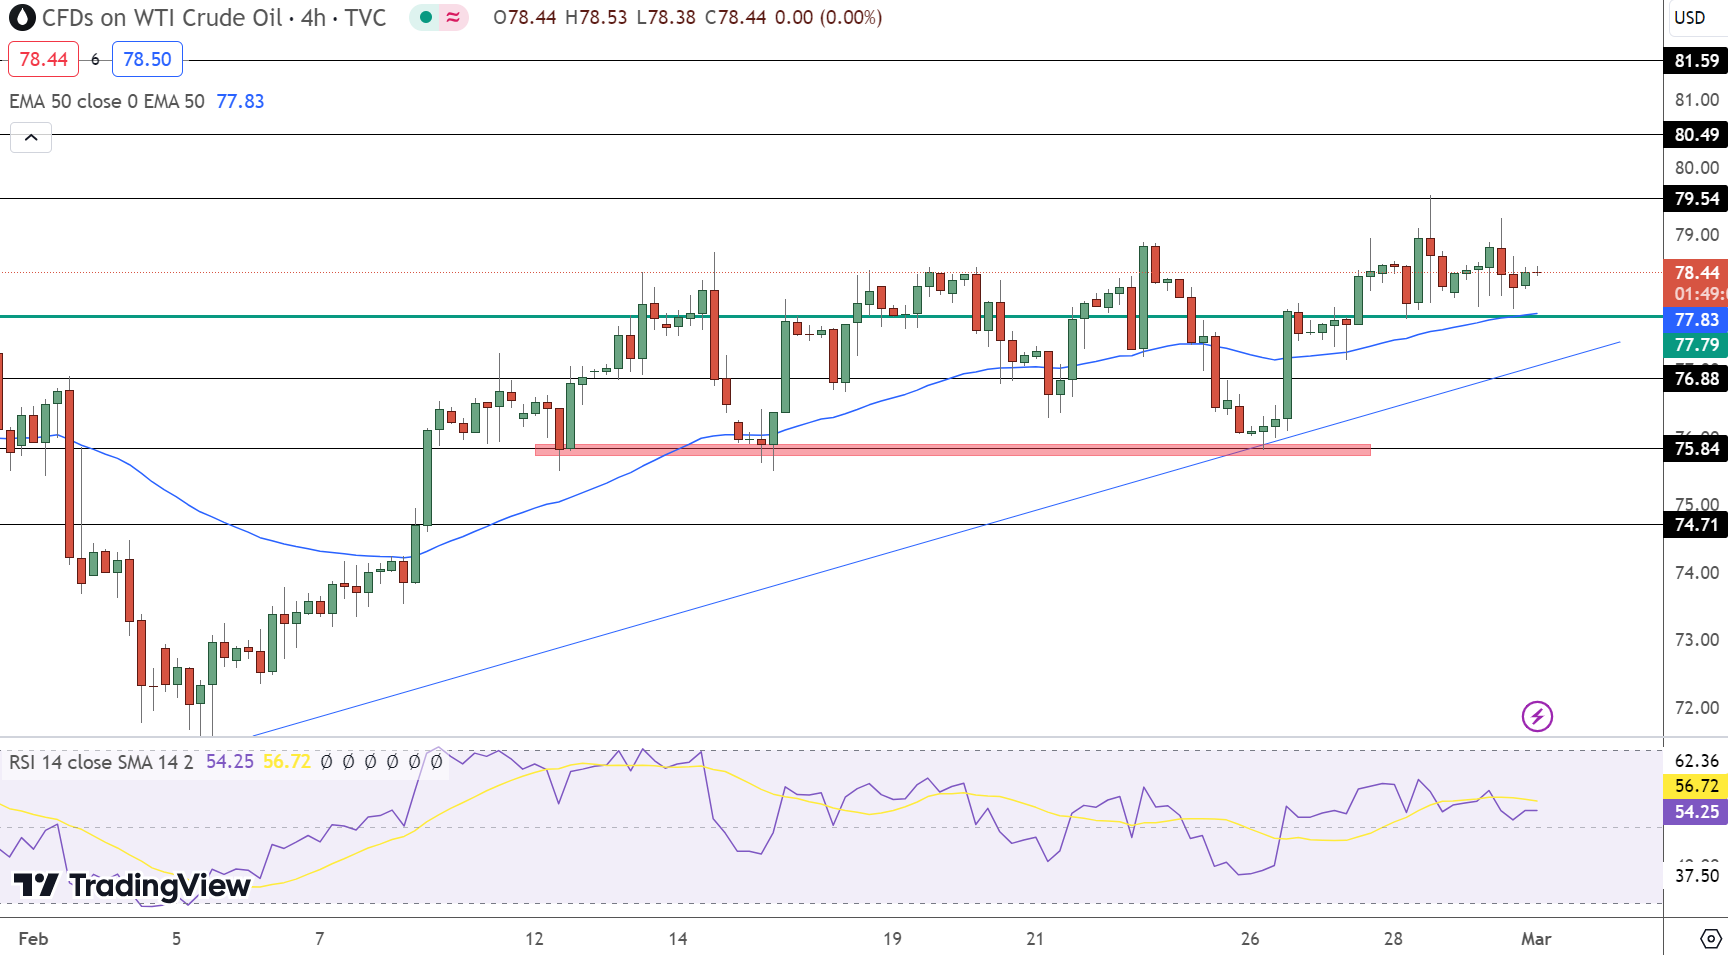
Crude Oil (USOIL) Price Forecast: Technical Outlook
Crude oil (USOIL) experienced a slight increase of 0.30% on March 1, pushing its price to $78.44. This upward movement is supported by a solid foundation at the pivot point of $77.79, with the asset encountering immediate resistance at $79.54, and further resistance anticipated at $80.49 and $81.59.
- Overall Trend: bullish sentiment above $77.75, indicating upward momentum.
- Key Resistance: immediate resistance at $79.54, with eyes on $80+ levels.
- Support Levels: Firm support is at $76.88, providing a safety net.

On the downside, support levels are established at $76.88, $75.84, and $74.71, which serve as critical thresholds for potential retracements.
A double bottom pattern and the 50-day Exponential Moving Average (EMA) at $77.83 support a bullish sentiment in technical analysis, which points to a continuing uptrend with targets aimed toward the $80 level.
- Check out our free forex signals
- Follow the top economic events on FX Leaders economic calendar
- Trade better, discover more Forex Trading Strategies
- Open a FREE Trading Account
- Read our latest reviews on: Avatrade, Exness, HFM and XM
ABOUT THE AUTHOR
See More
Arslan Butt
Lead Markets Analyst – Multi-Asset (FX, Commodities, Crypto)
Arslan Butt serves as the Lead Commodities and Indices Analyst, bringing a wealth of expertise to the field. With an MBA in Behavioral Finance and active progress towards a Ph.D., Arslan possesses a deep understanding of market dynamics.
His professional journey includes a significant role as a senior analyst at a leading brokerage firm, complementing his extensive experience as a market analyst and day trader. Adept in educating others, Arslan has a commendable track record as an instructor and public speaker.
His incisive analyses, particularly within the realms of cryptocurrency and forex markets, are showcased across esteemed financial publications such as ForexCrunch, InsideBitcoins, and EconomyWatch, solidifying his reputation in the financial community.
Related Articles

Sidebar rates
Related Posts
