Forex Signals Brief March 4: US Employment and ECB Meeting Highlighting the Week
Last week the US PCE inflation was the highlight of the week, this week we have the ECB meeting and many US employment reports

We started last week with everyone’s attention on the US PCE inflation report, which in the end wasn’t a game changer. It did move markets for a while, sending the USD 100 pips higher across the board as January’s numbers came above expectations, but that move was erased, so everything ended up unchanged at the end of the day.

The Reserve Bank of New Zealand meeting turned out to be more important in forex, which sent the Kiwi 100 pips lower after turning neutral. while markets were expecting another rate hike. This meeting has turned the sentiment bearish for the NZD, with the Business Confidence also declining.
On Friday, some weak data on various fronts from the US including ISM manufacturing, construction spending, and final UMich statistics, led to a decline in the dollar, while stock markets continued to surge to new highs, as did the crypto market, with BTC holding above $60,000.
This Week’s Market Expectations
This week will be mostly about the shape of the US employment sector, since we have a number of jobs reports on schedule, as shown below. The NFP report will close the week with a bang, if numbers are too distorted. However, the European Central Bank meeting will also attract a lot for attention in forex since the market is waiting for them to announce the first rate cut soon.
Here’s the economic calendar for the upcoming week:
Monday:
- Switzerland CPI (Consumer Price Index) Inflation Report
Tuesday:
- Tokyo CPI
- China Caixin Services PMI
- Eurozone PPI
- US ISM Services PMI
Wednesday:
- Australia GDP
- Eurozone Retail Sales
- US ADP Employment Report
- Bank of Canada (BoC) Policy Decision
- US Job Openings (JOLTS)
- Federal Reserve Chair Powell Testimony
Thursday:
- Japan Wage Data
- Switzerland Unemployment Rate
- European Central Bank (ECB) Policy Decision
- US Initial Jobless Claims
- Federal Reserve Chair Powell Testimony
Friday:
- US Non-Farm Payrolls (NFP)
- Canada Labour Market Report
Last the forex market week wasn’t too volatile, with the USD advancing first, before giving back the gains on Friday, while in stock markets and the cryptocurrency market the price action was quite strong and continued to surge higher. We opened 19 trading signals in total, with 4 closing in loss while the rest were closed in profit.
Highest Weekly Cose in Gold Prices
The strength in Gold prices continues, with XAU/USD heading towards $2,100. Last week, Gold prices surged by $42 to $2,085, marking the highest daily close in history. This surge in gold prices reflects ongoing demand for the precious metal amid market uncertainties and concerns about inflation. Investors often turn to gold as a safe-haven asset during times of economic uncertainty and as a hedge against inflation. The sustained gains in Gold prices indicate continued bullish sentiment in the market for the precious metal, however, the price is too higher to go long, and we’re contemplating a short to catch a pullback.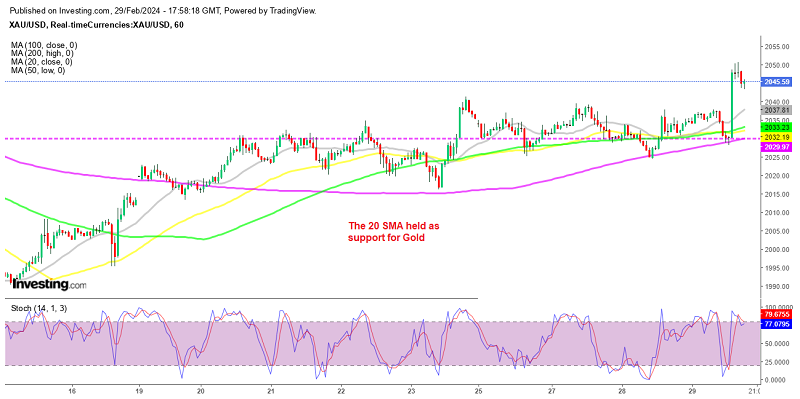
XAU/USD – H1 chart
NZD/USD Was the Weakest Pair Last Week
The NZD/USD ratio remained below 0.61 yesterday, with the pair trading within a 30-pip range. However, there is downward pressure on the New Zealand dollar, reflecting challenges in the New Zealand economy. January’s building permits recorded an 8.8% decline, indicating weakness in the construction sector. Despite this, consumer confidence improved last month. However, business confidence indicators deteriorated by 2 full points the previous day, suggesting ongoing challenges for the business sector. Overall, mixed economic data points to ongoing uncertainties and potential headwinds for the New Zealand economy, which is influencing the NZD/USD exchange rate.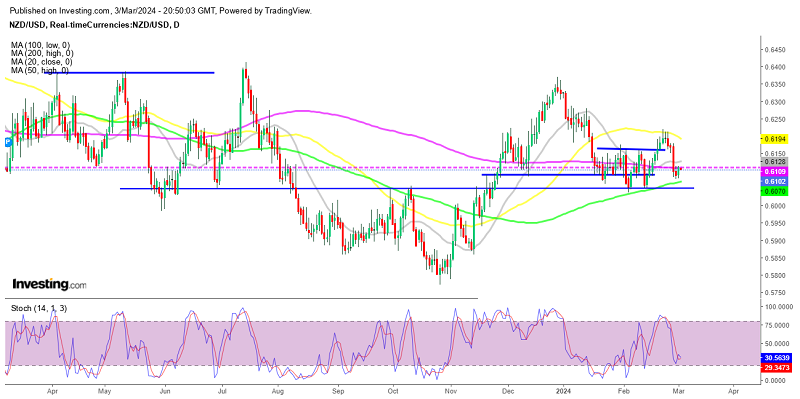
USD/CHF – Daily chart
Cryptocurrency Update
Bitcoin Holds Gains Above $60,000
Bitcoin continues to lead a surge in the cryptocurrency market, surpassing key milestones and approaching its all-time high below $69,000. After breaking through the $50,000 mark, Bitcoin has maintained its upward trajectory, exceeding $55,000 earlier this month. Yesterday, it surged above $60,000, reaching a peak of around $63,800. Although we initiated a buy signal for Bitcoin when its price was below $60,000, we closed it as Bitcoin retraced following the surge. Yesterday, the price found support at the 50 SMA (yellow), but now faces resistance at the 20 SMA.
BTC/USD – 60 minute chart
Ethereum Remains Supported by MAs
Ethereum has also seen a significant surge in value recently, following the upward trajectory of Bitcoin. However, the bullish momentum appears to be slightly subdued in comparison. This can be observed in the behavior of the 50-period simple moving average (SMA) line, represented by the yellow line on the hourly (H1) chart, which has been acting as a support level. On Wednesday, ETH/USD reached close to $3,500 before experiencing a decline of $400. Yesterday, the 50 SMA was breached after holding as support several times.
- ETH Buy Signal
- Entry Price: $2,290
- Stop Loss: $2,590
- Take Profit: $1,750
- Check out our free forex signals
- Follow the top economic events on FX Leaders economic calendar
- Trade better, discover more Forex Trading Strategies
- Open a FREE Trading Account
- Read our latest reviews on: Avatrade, Exness, HFM and XM
Related Articles


Sidebar rates
Related Posts
