Forex Signals Brief March 5: Will ISM Services Raise FED Cut Odds?
Today the ISM services highlight the day and traders are looking if they will come soft, which will bring a fed rate cut closer

The week started slow in forex, with the CHF making the biggest move, which fell around 50-60 pips across the board after the CPI inflation report, which in fact came in stronger than expected. The GBP emerged as the strongest currency on the other hand, followed closely by the Euro. The USD ended the day with small gains due to a lack of economic releases.

In the commodities market, Gold (XAG) continued to surge higher, climbing around $35 to reach $2119.85, while Silver (XAU) also saw an increase, rising by $0.80 to $23.95. Key stock market indices took a pause yesterday after reaching record highs on Friday, particularly the S&P and NASDAQ indices.
Today’s Market Expectations
The Tokyo Core CPI YoY which was released early in the morning, was expected to increase to 2.5% from the previous 1.6%, which was revised higher to 1.8% last night. Japan’s inflation has been on a downward trend and is currently close to target levels when excluding energy and food prices, but February’s CPI number came as anticipated at 2.5%. However, the Bank of Japan (BoJ) is particularly focused on wage growth, with the outcome of the spring pay negotiations expected to influence its policy decisions. Recent comments from the BoJ suggesting progress in pay negotiations and a more achievable inflation target of 2% prompted a strong market reaction, initially causing the Yen to surge before retracing most of its gains.
The US ISM Services report will be released in the afternoon and is expected to be 53.0 points, a slight decrease from the previous reading of 53.4. The latest S&P Global Services PMI fell short of expectations, indicating that while services output maintained positive momentum, the rate of growth slowed to a three-month low. Despite this, service providers continued to increase staffing levels, although the pace of hiring slowed due to concerns about declining orders caused by a decrease in sales growth. On the price front, cost inflation among firms slowed, but service providers continued to raise output costs.
Yesterday the price action in most forex pairs was slow due to a light economic calendar and central bank speakers. As a result, we opened 3 trading signals in total, with two reaching the targets by the end of the day, ending it with one winning and a losing signal.
Gold Moves Above $2,100 Again
Gold experienced a significant breakout above $2,100 without encountering significant resistance in the last several trading days. The 100 SMA (green) held as support for XAU in February and this month the sentiment is looking very strong as central banks prepare to embark on a rate cut process. Now we will see if Gold will break above the all-time high.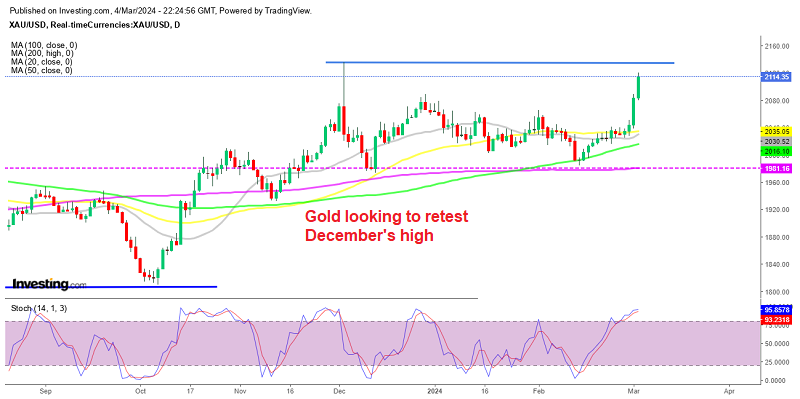
XAU/USD – Daily chart
EUR/USD Testing the 50 Daily SMA
EUR/USD slipped below 1.08 briefly, but it found support at the 100-period simple moving average (SMA) represented in green on the daily chart. From the lows of 1.0795, the pair bounced back, climbing back over the crucial psychological threshold of 1.0800. By the end of the week, it was trading above the 1.0830s level. Yesterday the bullish momentum continued and this pair pushed to 1.0867 where buyers met the 50 SMA which stopped the climb.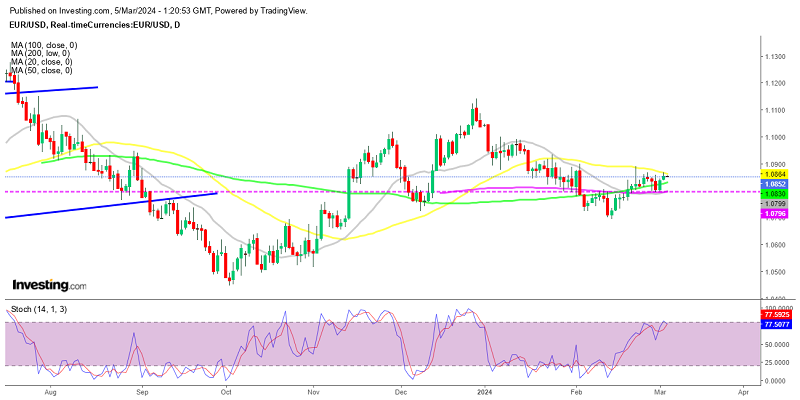
EUR/USD – Daily chart
Cryptocurrency Update
Bitcoin Back at Record Highs
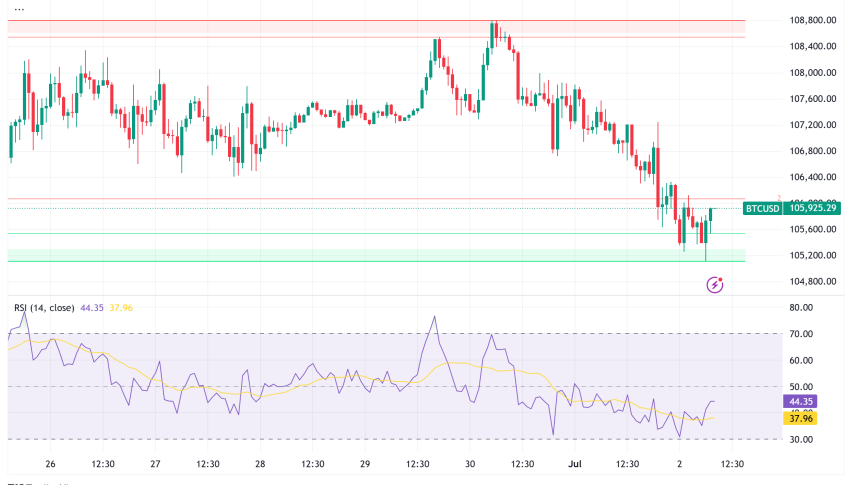
Bitcoin continues to lead the surge in the cryptocurrency market, surpassing key milestones and approaching its all-time high below $69,000. After breaking through the $50,000 mark, Bitcoin has maintained its upward trajectory, exceeding $55,000 earlier this month. Yesterday, it surged above $60,000, reaching a peak of around $68,200 yesterday. Although we initiated a buy signal for Bitcoin when its price was below $60,000, we closed it as Bitcoin retraced following the surge.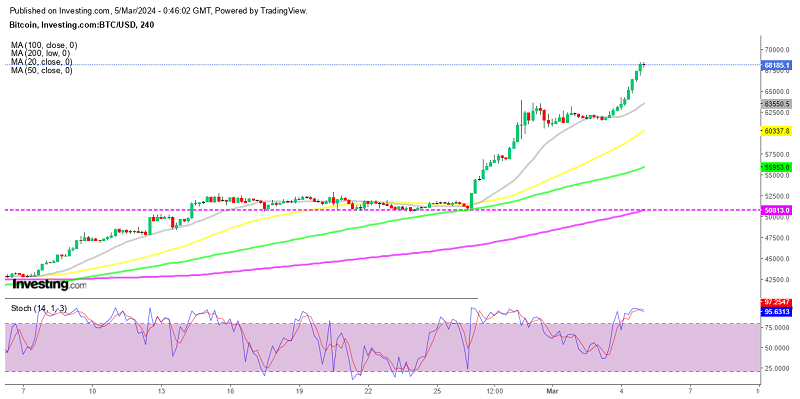
BTC/USD – Daily chart
Ethereum Back at Record Highs
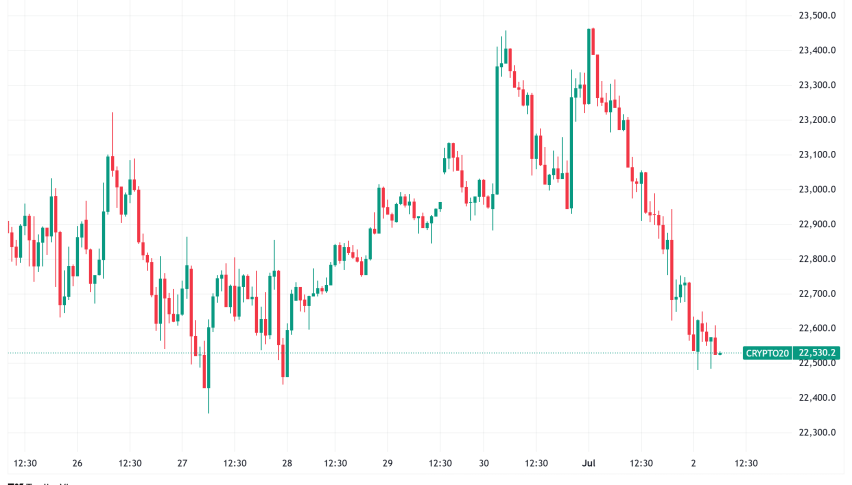
Ethereum has also found strong demand in recent months, increasing above $3,000 in February and this month buyers have pushed the price above $3,500, reaching $3,648 yesterday. The 20 SMA (gray) has been acting as support on the daily chart, which shows that the buying pressure remains very strong, as other moving averages can’t catch up.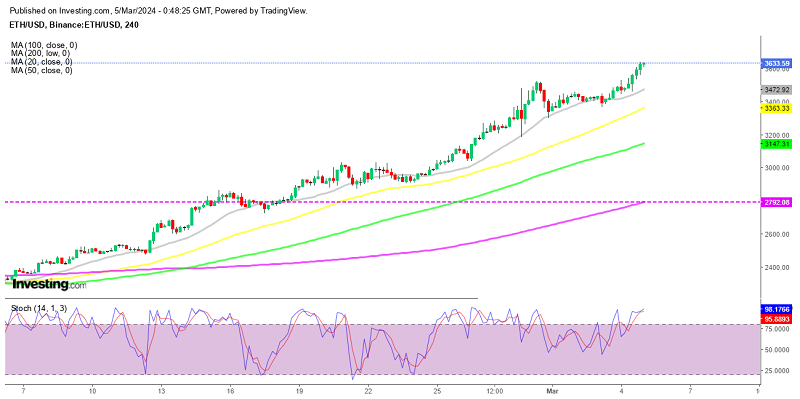
ETH/USD – 240 minute chart
- Check out our free forex signals
- Follow the top economic events on FX Leaders economic calendar
- Trade better, discover more Forex Trading Strategies
- Open a FREE Trading Account
