WTI Crude Oil Price Forecast: Nearing $78.80 on Fed Rate Cut Hopes & China’s Trade Recovery
WTI Crude Oil (USOIL) shows a modest increase, reaching approximately $78.80. This uptick is attributed to a weakening US Dollar

WTI Crude Oil (USOIL) shows a modest increase, reaching approximately $78.80. This uptick is attributed to a weakening US Dollar and anticipations of a Federal Reserve rate cut this year, highlighting a favorable WTI Crude Oil (USOIL) price forecast.

Support from China’s Trade Performance
Recent Chinese Import and Export figures for February exceeded expectations, offering a positive outlook on the world’s second-largest economy’s recovery.
As the top global crude oil consumer, China’s economic health directly influences WTI prices, underscoring the interconnection between global trade dynamics and oil markets.
Federal Reserve’s Interest Rate Outlook
Fed Chairman Jerome Powell’s recent remarks suggest that interest rates may decrease throughout the year, despite the central bank’s careful approach. This announcement could propel WTI prices upward, as lower interest rates typically stimulate oil demand by bolstering economic activity.
US Crude Inventory Insights
A less significant rise in US crude oil inventories than forecasted further supports WTI prices. The Energy Information Administration (EIA) reported a smaller-than-anticipated increase in stockpiles, pointing to a tightening oil market and potentially higher WTI prices.
Economic Events to Watch
Key economic indicators such as the Eurozone’s GDP revision for Q4, alongside US employment figures, could significantly sway WTI prices. These events offer critical insights for oil traders, guiding investment strategies in the WTI market.
Crude Oil (USOIL) Price Forecast: Technical Outlook
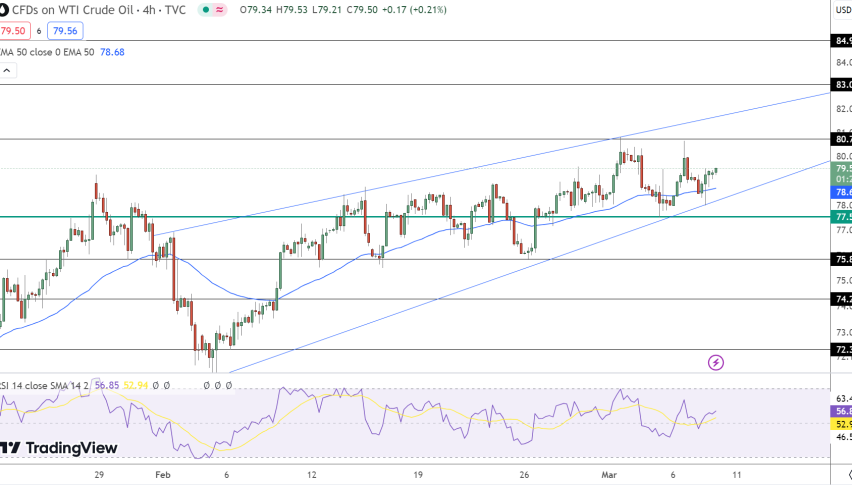
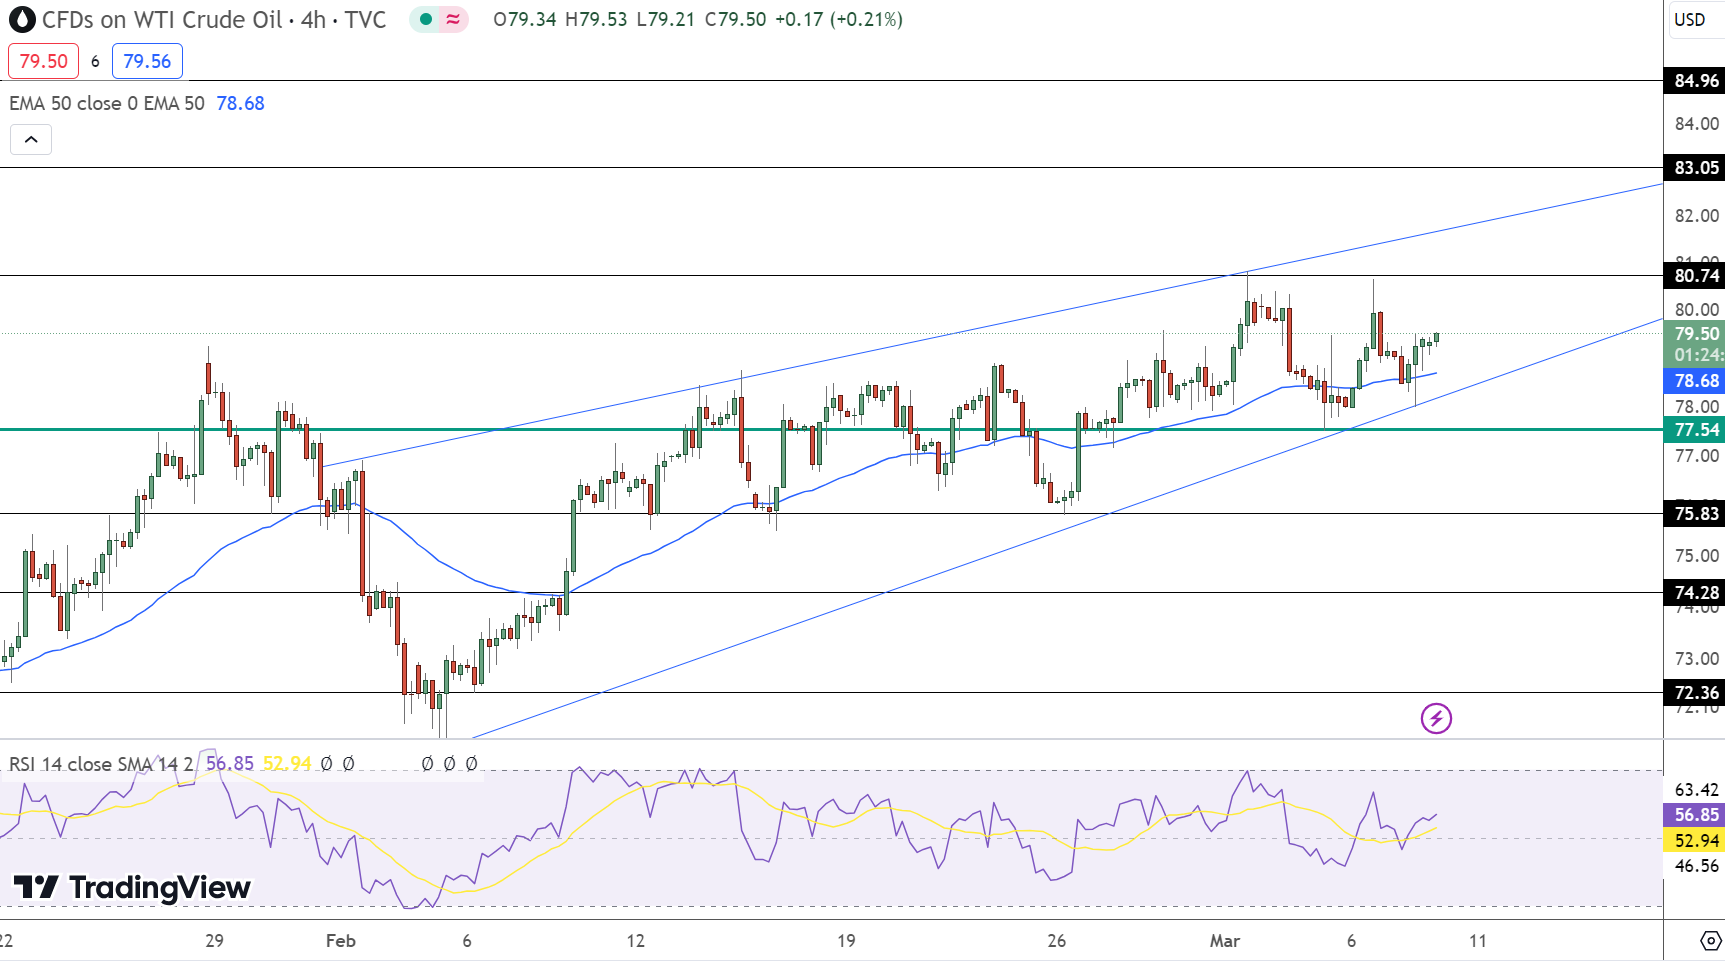
Crude Oil (USOIL) exhibits a minor increase of 0.12%, trading at $79.5, pointing towards a cautiously optimistic market outlook.
The pivot point at $77.54 serves as a critical juncture, with resistance levels at $80.74, $83.05, and $84.96 dictating potential upward momentum.
Conversely, support figures at $75.83, $74.28, and $72.36 safeguard against declines.

The Relative Strength Index (RSI) at 56, coupled with the 50-Day Exponential Moving Average (EMA) at $78.68, signals a bullish predisposition, advocating for buy positions.
This technical analysis underscores a bullish trend, contingent on sustaining above the $78.68 threshold, highlighting a nuanced interplay between market forces and technical indicators.
- Check out our free forex signals
- Follow the top economic events on FX Leaders economic calendar
- Trade better, discover more Forex Trading Strategies
- Open a FREE Trading Account


