Bearish Chart Pattern in EUR/USD After German Inflation Figures
The euro to dollar rate increased considerably in the last few weeks, but it has formed a bearish chart pattern after failing to reach 1.10

The euro to dollar rate increased considerably in the last few weeks, but it has formed a bearish chart pattern after failing to reach 1.10 on Friday. EUR/USD gained almost 3 cents since mid-February, and got within reach of the major level at 1.10, but the buying stopped just below that level and now it seems like we might see a deeper pullback after the final German CPI inflation report, however, traders are waiting for the US inflation report as well before making a decisive move.
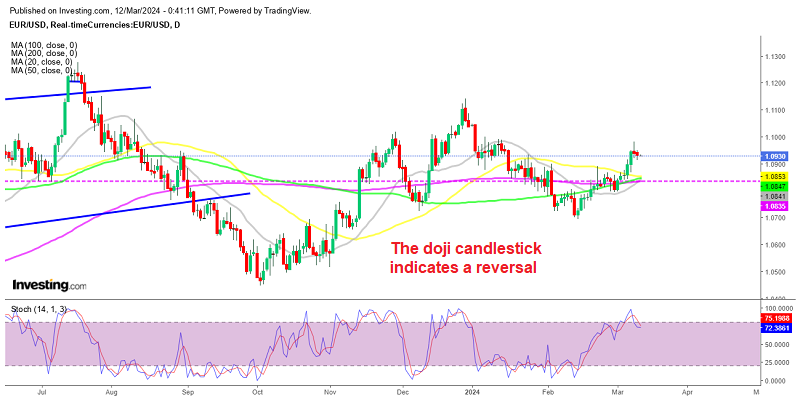
EUR/USD Daily Chart – The Doji Candlestick Indicates A Reversal
EUR/USD has been on an upward trajectory since mid-February, rebounding after dipping slightly below 1.07. Despite facing resistance from the 50-day Simple Moving Average (SMA) below 1.09 for over a week, the uptrend resumed last week, particularly after weaker-than-expected US jobs data. Additionally, the European Central Bank (ECB) refraining from discussing rate cuts further supported the Euro’s strength against the US dollar.
Analyzing the daily chart above, it’s evident that the EUR/USD pair has been steadily climbing, with favoring bullish sentiment. However, there are indications emerging that a correction may be imminent. Technical indicators, such as the Stochastic oscillator, have exited the overbought zone on the daily chart, signaling a potential sell signal.
EUR/USD made two strong bullish candlesticks on Wednesday and Friday last week and the positive momentum continued during the first two sessions on Friday. But, the reversal came after the US NFP employment report, which showed stronger headline numbers, but the details were weaker. As a result, Friday’s candlestick closed as a doji, which indicates a reversal after the climb and yesterday the decline continued. So it seems like the bearish reversing chart pattern if working, however, we have to wait for the US inflation report, because it can ruin everything. However, the odds of a strong US CPI report are lower than those of a weak one.
EUR/USD Live Chart
- Check out our free forex signals
- Follow the top economic events on FX Leaders economic calendar
- Trade better, discover more Forex Trading Strategies
- Open a FREE Trading Account


