AUD/USD Price Forecast: Gains Post U.S. CPI, Eyes on Fed Moves; Buy Above 0.6600?
The AUD/USD pair shows a modest increase of 0.10%, trading at 0.66132. This subtle upswing reflects market reactions to U.S. inflation

The AUD/USD pair shows a modest increase of 0.10%, trading at 0.66132. This subtle upswing reflects market reactions to U.S. inflation reports and the Federal Reserve’s interest rate projections.

Inflation Insights Stir the Market:
The U.S. CPI for February revealed a 3.2% year-on-year increase, slightly above the anticipated 3.1%. This development suggests persistent inflationary pressures, reinforcing the Fed’s cautious approach to rate adjustments.
The core CPI, which excludes volatile food and energy prices, recorded a 3.8% rise year-on-year, hinting at underlying inflation slightly above the 3.7% forecast.
Dollar Dynamics and Yield Movements:
Post-report, the U.S. dollar gained strength, with the Dollar Index (DXY) rising 0.18% to 102.92. This surge reflects the impact of rising U.S. Treasury yields on the currency, pressuring the AUD/USD pair downward.
Fed Rate Speculation Adjustments:
Market sentiment on a potential June rate cut by the Fed has been recalibrated to a 68% likelihood, down from 72%, as investors digest the inflation data’s implications.
Australian Economy at a Glance:
February’s business conditions at the National Australia Bank improved to 10.0, from 6.0, showcasing economic resilience. However, business confidence levelled at 0.0, presenting a cautious outlook.
Anticipated Data Releases:
Attention now turns to the U.S. retail sales for February, which are expected to increase by 0.8% month-on-month. This data, alongside the control group’s anticipated 0.4% rise, will be crucial for future AUD/USD movements, offering fresh insights into consumer spending and economic health.
AUD/USD Price Forecast: Technical Outlook
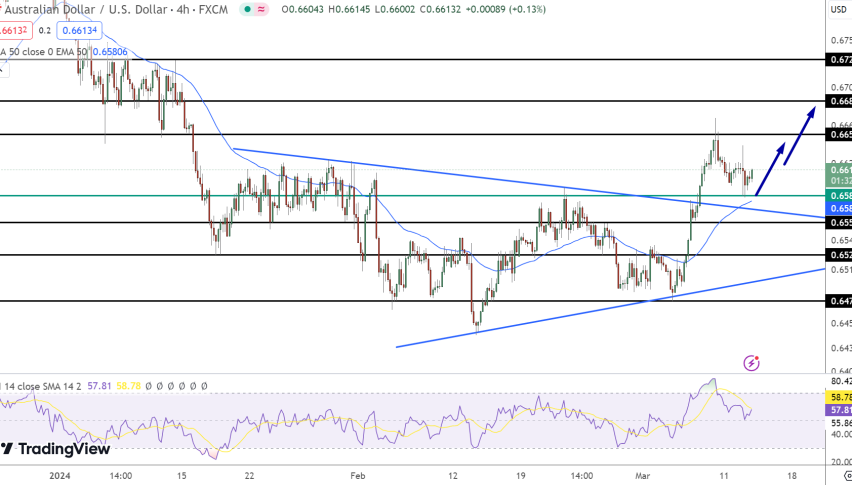
The Australian Dollar (AUD) against the US Dollar (USD) displayed modest growth in today’s market, with a 0.10% increase, positioning it at 0.66132.
This development signals a positive sentiment as the pair tests the pivotal support-turned-resistance mark at 0.6587.
With resistance lines drawn at 0.6651, 0.6686, and 0.6730, the currency faces challenges ahead. Support benchmarks are set at 0.6559, 0.6525, and 0.6478, offering potential safety nets for the pair.

The 50-day Exponential Moving Average (EMA) at 0.6581 and the Relative Strength Index (RSI) at 57 both show that the market’s momentum is skewed towards bullish territory. The pair’s performance above the 0.6587 threshold hints at a buying trend gaining traction, making this level crucial for future direction.
- Check out our free forex signals
- Follow the top economic events on FX Leaders economic calendar
- Trade better, discover more Forex Trading Strategies
- Open a FREE Trading Account


