Forex Signals Brief March 15: A Last Round of US Data Before Weekend
Today we have the Empire State Manufacturing Index, Industrial Production and UoM Consumer Sentiment to close the week for the USD

Yesterday was quiet in the first half of the day, but traders were awaiting the US data, but there was a slight USD bullish bias, as traders feared a strong retail sales report from the US. However, the market largely overlooked the retail sales numbers, choosing instead to focus on the PPI inflation and unemployment claims, which will have some impact on next week’s Federal Reserve meeting.

US Treasuries led a selloff, driven by expectations that the Fed might lower its median dot plot to 50 basis points from the previously projected 75 basis points for 2024. Additionally, there is growing speculation that the Bank of Japan may phase out its extraordinary programs, including negative interest rates.
So, despite weaker retail sales data, the dollar strengthened. Some attributed this to higher Producer Price Index (PPI)at 0.6% MoM and stronger unemployment claims data, which provided support for the dollar. Following the release of the economic data, there was some turbulence in the dollar’s bid, but buyers eventually gained momentum, leading to a significant increase of almost 50 pips in a relatively steady upward movement.
Today’s Market Expectations
The day started with events from China. The People’s Bank of China (PBoC) is scheduled to conduct its Medium-Term Lending Facility (MLF) operation next Friday, with the 1-year MLF rate expected to remain unchanged at 2.50%. Last month, the PBoC maintained its 1-year MLF rate during a CNY 500 billion operation, aiming to sustain reasonably ample liquidity in the banking system. Additionally, the central bank has not adjusted its shorter-term funding rates, as evident from the unchanged 7-day reverse repo rate since August last year.
Besides that, in a surprising move last month, the PBoC maintained the 1-year Loan Prime Rate (LPR) at 3.45%, contrary to expectations of a 5 basis points cut. However, there was a deeper than anticipated reduction in the 5-year LPR, which was lowered by 25 basis points to 3.95% (versus an expected 10 basis points reduction). The 5-year LPR serves as the reference rate for mortgages in China. These actions suggest the central bank’s cautious approach to adjusting monetary policy rates amidst economic conditions and liquidity considerations.
The calendar is light in the European session, but in the US session we have a umber of releases, such as the Empire State Manufacturing Index which is expected to remain negative again at -7 points while Industrial Production is expected to remain flat at 0.0%. Later toward the end, the Prelim UoM Consumer Sentiment is expected to come at 77.1 points.
Yesterday markets were slow during the Asian and European session, with a slight bullish tilt in the USD ahead of the retail sales. But, the market ignored them and focused on the other reports, which sent the USD higher in the afternoon. We had two trading signals closed yesterday, both hit the take profit target.
Gold Retreats Off the Highs
The price of gold, represented by XAU/USD, experienced a retreat prior to further decline following the release of the Producer Price Index (PPI) and unemployment claims numbers. XAU/USD fell to $2,152, but this level has now turned into a support zone for gold. Subsequently, we witnessed another bounce today, following the rebound seen yesterday. This indicates that the $2,152 level is providing support for gold prices, suggesting potential buying interest at this level. We decided to open another buy Gold signal above this level, after booking profit on the previous one.
XAU/USD – 240 minute chart
Silver Breaks Above $25
The Euro has shown some strength against the US Dollar, climbing by approximately 3 cents from its recent low to its peak. However, buyers were unable to push the price above the 1.10 level last week, with the price reaching only the 1.0980s. This week, the high was even lower at 1.0965, indicating a potential trend reversal as the highs are descending.
Currently, the EUR/USD pair has retraced around 100 pips from its recent highs and is encountering resistance from moving averages. If these moving averages are breached, it could signal further downside movement. The next significant support levels to watch for are around 1.08, where the 200-period Simple Moving Average (SMA) stands, followed by 1.07 for the EUR/USD pair. These levels could serve as potential targets if the downward momentum continues.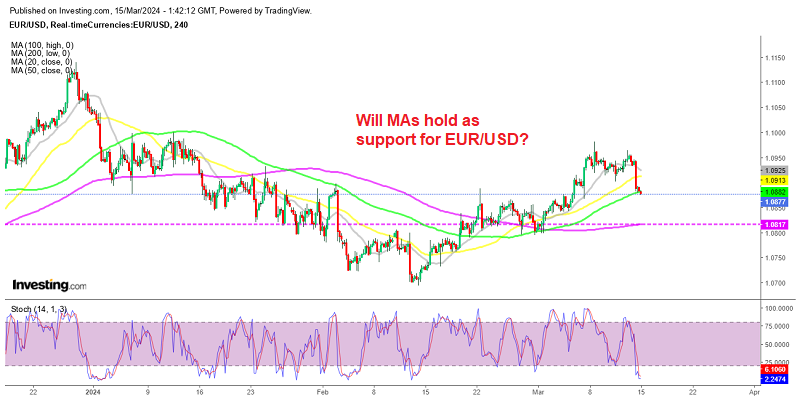
EUR/USD – 240 minute chart
Cryptocurrency Update
Bitcoin Dips Below $68,000 but the 100 SMA Holds
Bitcoin (BTC) experienced a turbulent day yesterday following its recent attainment of a new all-time high. The cryptocurrency found support near the 50-period Simple Moving Average (SMA), suggesting a potential reversal in the short term. The decision to initiate a buy signal at this support level seems to have been well-timed, as evidenced by the subsequent price recovery. However, the failure to surpass the $70,000 mark indicates strong resistance in the market. Consequently, BTC briefly dropped below $68,000, breaking the 50 SMA (yellow) but the 100 SMA held.
BTC/USD – 240 minute chart
The 100 SMA Holds As Support for Ethereum
ETH (Ethereum) continued its upward trajectory last week, despite experiencing a bearish reversal after surpassing the significant $4,000 milestone. However, despite this reversal, ETH managed to find support above the 50-period Simple Moving Average (SMA) on the H4 chart, a crucial technical indicator. This support level attracted buyers, leading to a bounce in the price of ETH. Subsequently, ETH reached a new yearly high of $3,900, indicating sustained positive sentiment in the market. Traders will closely monitor the price action of ETH to assess whether it can sustain its upward momentum and potentially breach the psychologically important $4,000 level in the near future. Some traders believe that if ETH successfully establishes itself above the $4,000 level, it could set its sights on reaching $5,000.
ETH/USD – 240 minute chart
- Check out our free forex signals
- Follow the top economic events on FX Leaders economic calendar
- Trade better, discover more Forex Trading Strategies
- Open a FREE Trading Account
- Read our latest reviews on: Avatrade, Exness, HFM and XM
Related Articles


Sidebar rates
Related Posts
