WTI Retraces to Important Support Level – Bull Trend Intact
Baker Hughes Oil Rig Count came in lower than last week at 509 from 510, the market’s reaction was bearish.


Baker Hughes Oil Rig Count came in lower than last week at 509 from 510, the market’s reaction was bearish.
The crude oil market took a turn south after today’s oil count which showed a decline in the number of operating rigs by 1. Not exactly a significant variation from the previous week’s number.
However, it was enough to steer the market back into bear mode after the day had started with a rally. Traders are still concerned that despite a decrease in demand, the already mentioned production cuts will not be sufficient.
The crude oil market looks set to post 3 consecutive losses even after Wednesday’s EIA crude oil stocks showed a 1.95 million barrels decline. It could be the market was expecting a greater decrease in oil stocks than the number released.
In any case, the sentiment seems to be easily nudged into a bearish reaction despite what appears to be bullish news. The same goes for today’s rig count, true it’s only a small reduction in rigs, but it shouldn’t produce a clear bear run in the market.
We’ll get more clues next week on demand from the US as we have various economic data scheduled:
- March 26 – Durable Goods
- March 28 – GDP Growth
- March 28 – Michigan Consumer Sentiment
Technical View
The chart below shows that the bull trend for WTI is still intact, at least for now. Today’s candle is hovering around the support area (gray line) that the market broke out of only 7 sessions ago. Retracements are common after a breakout of a support or resistance level.
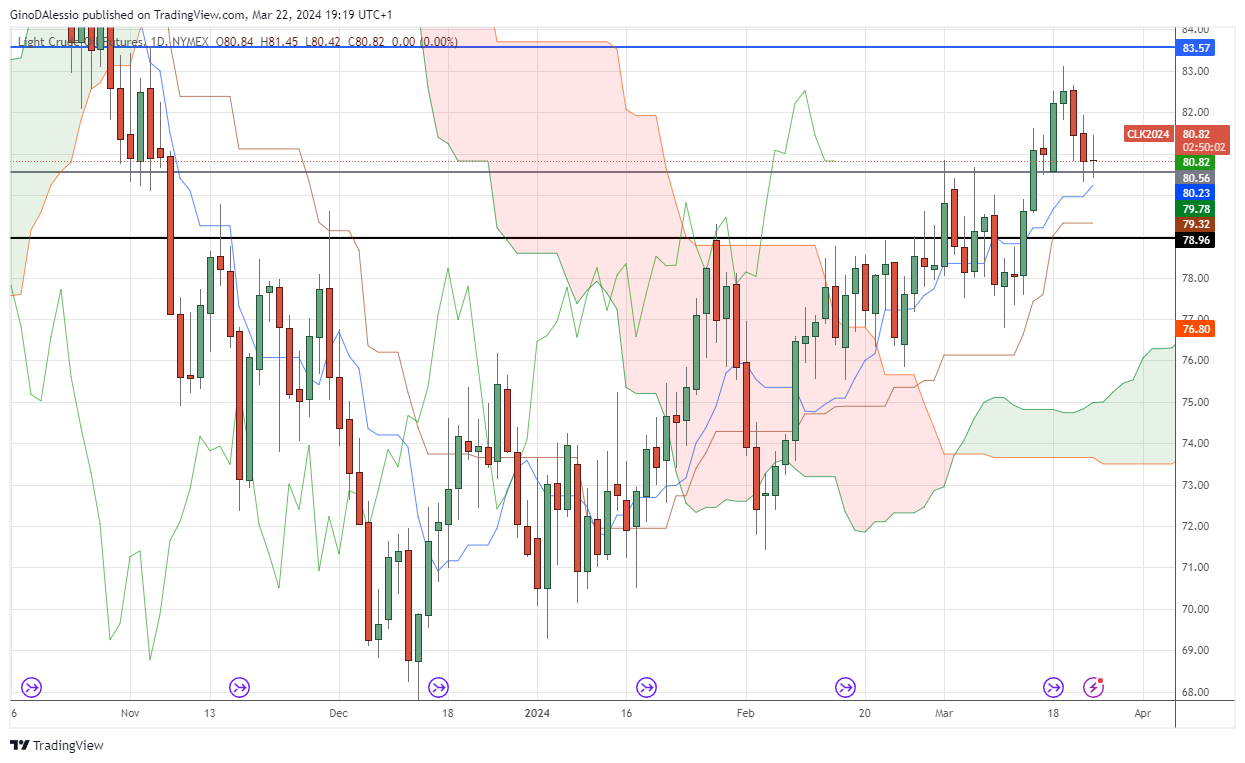
So, we’ll have to wait for Monday’s candle to see if the support area holds or not. If the current support line breaks then we have the next support at 78.96 level (black line). Any further selling pressure would be met after that by the support of the Ichimoku cloud.
If the market does manage to stay above the support level and print a green candle we could see further price increases. The next major resistance level in this case would be at 83.57 (blue line) set in April 2023, which led to a major selloff of 23.8%.
- Check out our free forex signals
- Follow the top economic events on FX Leaders economic calendar
- Trade better, discover more Forex Trading Strategies
- Open a FREE Trading Account
- Read our latest reviews on: Avatrade, Exness, HFM and XM
Related Articles


Sidebar rates
Related Posts
