Gold Price Nears $2172 Amid Fed Rate Cut Hopes & Ukraine Tensions
Gold's modest uptick of 0.22%, reaching $2171.345, highlights its stability amidst evolving economic conditions this Monday.
Gold‘s modest uptick of 0.22%, reaching $2171.345, highlights its stability amidst evolving economic conditions this Monday. The precious metal’s rebound is driven by growing anticipation of the U.S. Federal Reserve’s potential rate cuts later this year, with all eyes on the forthcoming U.S. GDP data for Q4, anticipated to hold at 3.2%.
Fed’s Rate Strategy and Gold’s Appeal:
The Federal Reserve’s decision to maintain its benchmark interest rate steady, coupled with Chairman Jerome Powell’s indication of possible rate reductions in 2024, has catalyzed investor interest in gold.
Market sentiment, buoyed by an increase in the likelihood of a rate cut by June, amplifies gold’s attractiveness as a hedge against currency depreciation.
Geopolitical Tensions Elevate Safe-Haven Demand:
The recent escalation in Ukraine, marked by attacks on vital infrastructure, underscores the ongoing geopolitical strife that could further enhance gold’s status as a refuge for investors seeking stability in tumultuous times.
Economic Data to Shape Market Direction:
This week, gold market participants will scrutinize the U.S. GDP growth figures for Q4 closely. An outcome surpassing expectations might bolster the U.S. dollar, potentially dampening gold’s allure.
Additionally, with markets observing Good Friday, short-term trading strategies might pivot on the anticipated economic updates.
As gold navigates through these economic indicators and geopolitical developments, its price trajectory remains a focal point for investors gauging the balance between risk and security in a landscape marked by uncertainty and speculation.
Gold Price Forecast: Technical Outlook
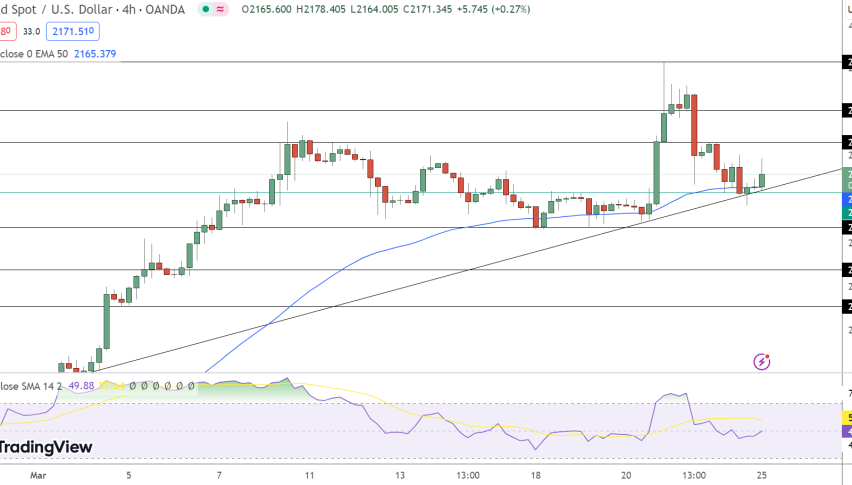
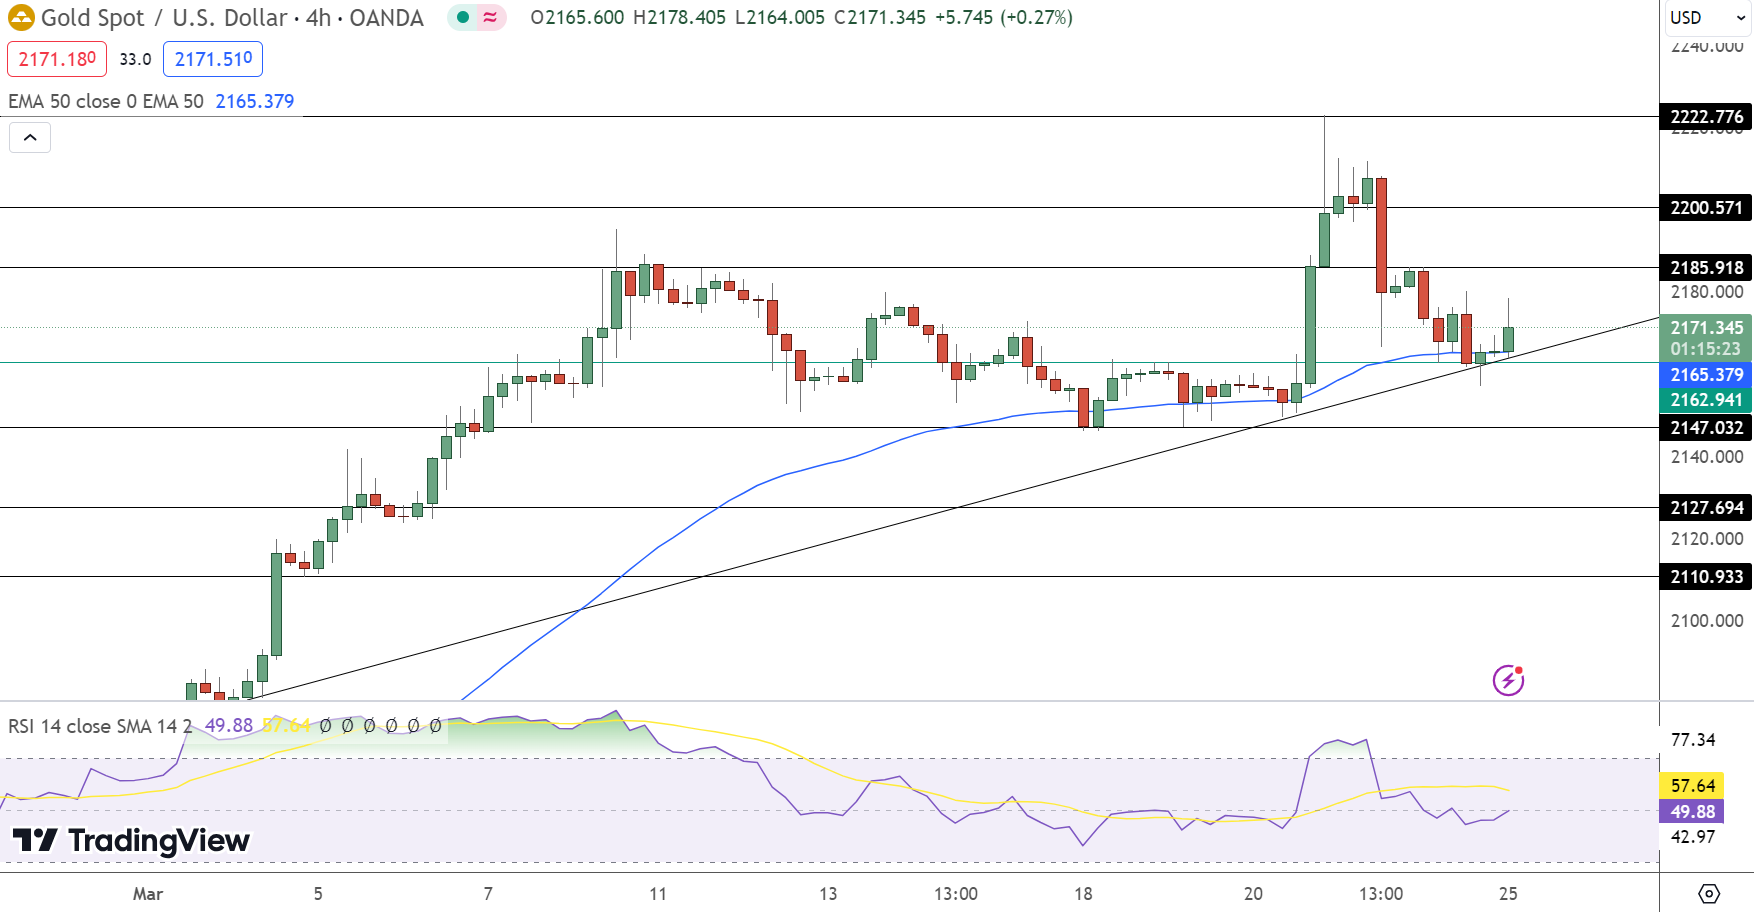
GOLD slight gain of 0.22% to $2171.345 underscores the metal’s resilience in the face of fluctuating market dynamics. Navigating through pivotal price levels, gold’s immediate outlook pivots at $2162.94, setting a benchmark for its short-term trajectory.
The ascent to resistance levels at $2185.92, $2200.57, and ultimately $2222.78 awaits, should gold sustain its bullish momentum. Conversely, supports at $2147.03, $2127.69, and $2110.93 offer a safety net against potential downturns.
The Relative Strength Index (RSI) at 49, alongside the 50-day Exponential Moving Average (EMA) at $2165.38, signals a balanced market sentiment, slightly leaning towards bullish undercurrents.
This technical landscape, bolstered by an upward trendline, showcases gold’s potential for sustained growth above the $2162.94 level, inviting vigilant observation for any shifts that could redefine the bullish or bearish narrative in the upcoming sessions.
- Check out our free forex signals
- Follow the top economic events on FX Leaders economic calendar
- Trade better, discover more Forex Trading Strategies
- Open a FREE Trading Account
- Read our latest reviews on: Avatrade, Exness, HFM and XM
Related Articles


Sidebar rates
Related Posts
