USD/JPY Price Forecast: BoJ’s Strategy May Influence Rise Above 151.314
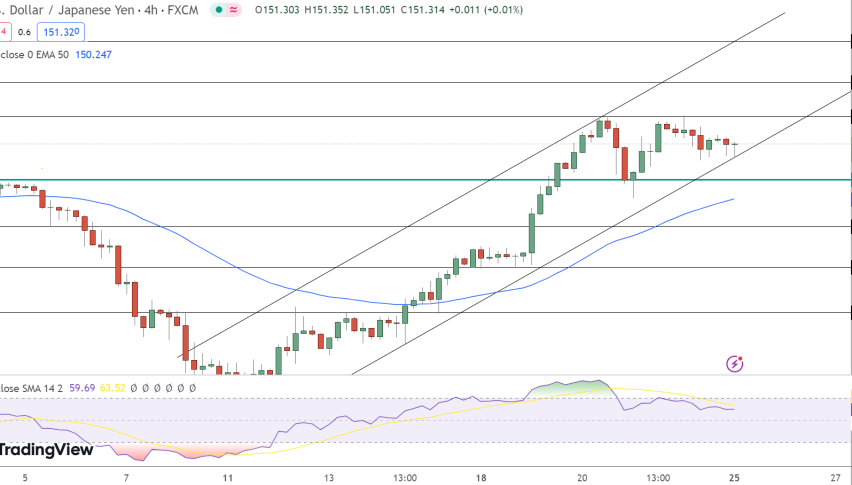
The USD/JPY currency pair registered a marginal decrease, settling at 151.314, reflecting a 0.08% drop.

The USD/JPY currency pair registered a marginal decrease, settling at 151.314, reflecting a 0.08% drop. This minor retreat occurs amidst discussions from the Bank of Japan’s (BoJ) January meeting, highlighting a gradual approach to meeting inflation targets.

The possibility of implementing new strategies, should the synergy between wage growth and inflation become evident, was also deliberated, noting a reduced risk of inflation overshooting expectations.
Bank of Japan’s Inflation Strategy:
BoJ’s latest meeting minutes suggest cautious optimism toward achieving inflation targets, potentially influencing JPY’s trajectory.
Forex Intervention on the Horizon: With Japan’s Masato Kanda hinting at steps to counteract undue JPY weakness, forex markets are on alert for potential interventions.
D XY’s Decline Amidst Fed’s Hawkish Tones:
Despite the DXY’s slip, USD gained traction following Federal Reserve Bank of Atlanta President Raphael Bostic’s comments, adjusting his rate cut expectations due to persistent inflation and robust economic indicators.
As the USD navigates through these developments, anticipation grows around the Federal Reserve’s next moves, especially with projections leaning towards a rate easing cycle commencing in June.
The Federal Reserve’s stance on not reacting precipitously to recent inflation upticks further adds layers to the USD/JPY price forecast, suggesting a complex interplay of domestic and international policy moves on its future direction.
USD/JPY Price Forecast
The USD/JPY pair shows a slight decline, dropping 0.08% to 151.314. Despite this dip, technical analysis suggests an underlying strength in the pair, anchored by a pivot point at 150.62.
Overcoming this level, immediate resistance is found at 151.85, with subsequent barriers at 152.50 and 153.30 hinting at growth potential. Conversely, support levels at 149.72, 148.94, and 148.05 act as cushions against further declines.

The 50-day Exponential Moving Average (EMA) at 150.25, alongside a Relative Strength Index (RSI) of 59, underscores a bullish sentiment, particularly if the pair maintains above the crucial 151.300 threshold.
This combination of technical indicators suggests the pair may continue its upward trajectory, contingent on holding above 150.62.
- Check out our free forex signals
- Follow the top economic events on FX Leaders economic calendar
- Trade better, discover more Forex Trading Strategies
- Open a FREE Trading Account


