Does Polkadot (DOT) Have Potential for Growth This Market Cycle?
Polkadot (DOT) has seen a modest 15.31% increase year-to-date (YTD), lagging behind some top-ranking tokens. However, analysts see reasons
•
Last updated: Wednesday, March 27, 2024
Polkadot (DOT) has seen a modest 15.31% increase year-to-date (YTD), lagging behind some top-ranking tokens. However, analysts see reasons to be optimistic about its future.
Analyst View: Ecosystem Growth and Polkadot 2.0 to Drive Price
Analyst Michaël van de Poppe believes sustained growth in the Polkadot ecosystem could propel DOT to a breakout. He also highlights the upcoming Polkadot 2.0 upgrade, designed to address scalability, interoperability, and security concerns, as a potential source of price increase.
Polkadot Ecosystem Shows Strength
Despite the lackluster YTD performance, Polkadot’s ecosystem exhibits positive signs. Here’s a breakdown:
- Total Value Locked (TVL) Up: A key metric of a protocol’s health, Polkadot’s TVL has seen a significant jump across all 11 chains on the network. This indicates strong user trust and locked assets.
- Funding Rate Suggests Positive Momentum: Though lower than earlier, the positive funding rate suggests DOT is trading at a premium, with spot traders actively buying. This could lead to a short-term price increase.
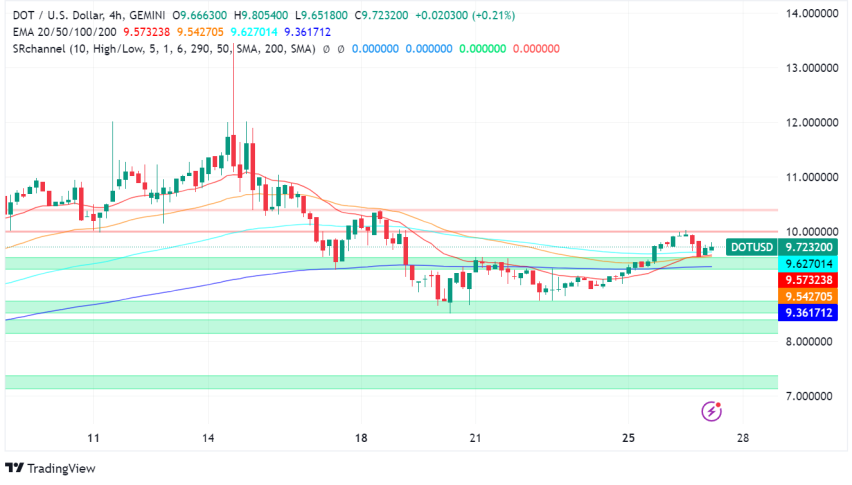
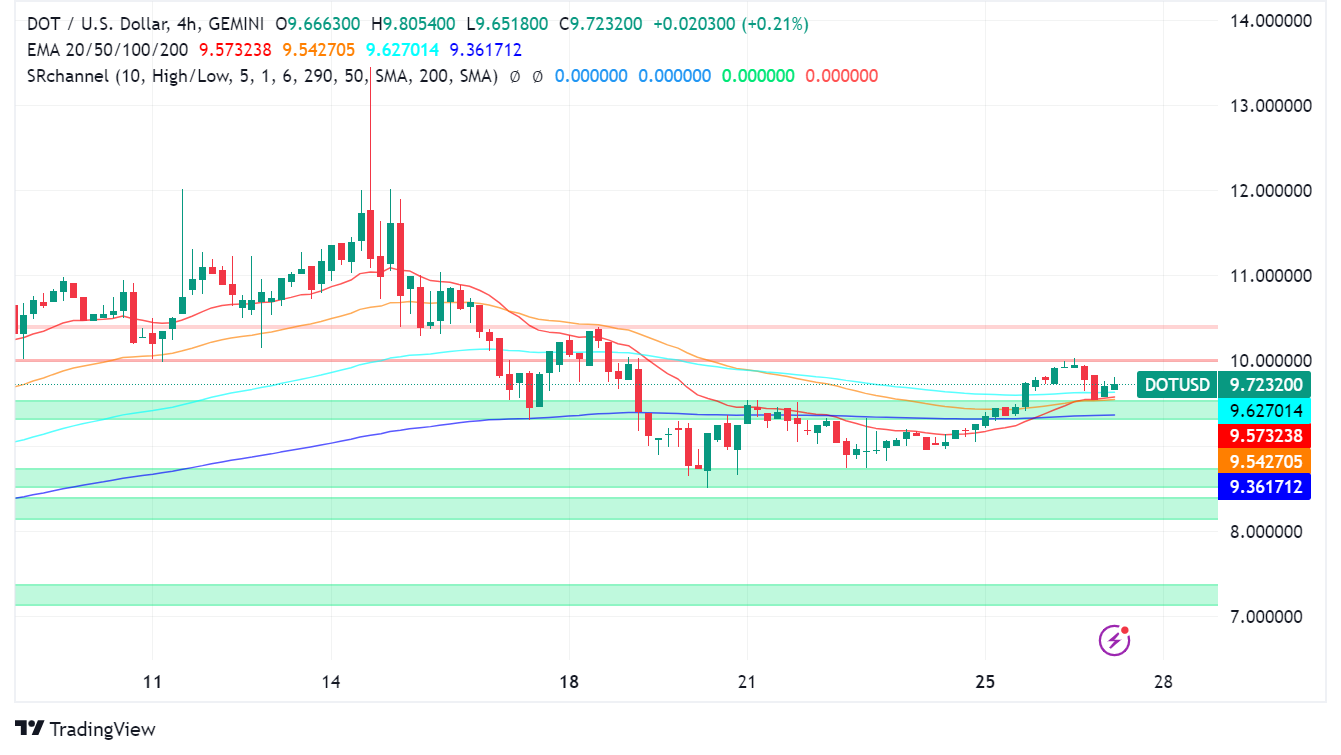
DOT/USD Technical Analysis: Potential for Upside?
- Bullish Patterns: AltFINS’ technical analysis reveals a breakout from a falling wedge pattern, typically a bullish indicator.
- Pullback Entry Points: A potential pullback near the $8 support level could present an attractive buying opportunity for swing traders, offering a potential 25% upside to $10. The recommended stop loss is $7.20.
- Check out our free forex signals
- Follow the top economic events on FX Leaders economic calendar
- Trade better, discover more Forex Trading Strategies
- Open a FREE Trading Account
- Read our latest reviews on: Avatrade, Exness, HFM and XM
ABOUT THE AUTHOR
See More
Arslan Butt
Lead Markets Analyst – Multi-Asset (FX, Commodities, Crypto)
Arslan Butt serves as the Lead Commodities and Indices Analyst, bringing a wealth of expertise to the field. With an MBA in Behavioral Finance and active progress towards a Ph.D., Arslan possesses a deep understanding of market dynamics.
His professional journey includes a significant role as a senior analyst at a leading brokerage firm, complementing his extensive experience as a market analyst and day trader. Adept in educating others, Arslan has a commendable track record as an instructor and public speaker.
His incisive analyses, particularly within the realms of cryptocurrency and forex markets, are showcased across esteemed financial publications such as ForexCrunch, InsideBitcoins, and EconomyWatch, solidifying his reputation in the financial community.
Related Articles

Sidebar rates
Related Posts
