Forex Signals Brief March 27: Inflation Holds Steady in Australia
The main event already happened today, with the Australian CPI remaining unchanged

Yesterday was a relatively calm day in the markets, with no major dramatic events occurring. Despite weak economic data and a robust Treasury auction, the US dollar managed to gain ground. USD/JPY experienced significant buying interest during the London fix, while other currency crosses saw mixed movements.

The commodity currencies attempted to rally during the Asian session but retraced their gains later in the day. In the commodities market, oil prices initially rose but later fell back due to increased selling pressure following the release of API oil inventory data. The US Durable Goods Orders turned positive, but the non-manufacturing data and Consumer Confidence were weak.
Gold made an attempt to reach $2,200, just touching that level in the European session after a $30 surge, but failed to hold on to the gains, ultimately settling at $2,178 at the end of the day. Overall, it appears that market participants were cautious, and flows played a significant role in driving currency and commodity movements throughout the day.
Today’s Market Expectations
It started with the Australian Monthly Consumer Price Index (CPI) this morning which was expected to increase to 3.5% year over year, up from the previous reading of 3.4%, but it remained unchanged, which weighed slightly on the AUD. The Month-on-month CPI rose by 0.5%, surpassing the previous month’s increase of 0.4%, while the ‘core’ Trimmed Mean reading showed a year-on-year increase of 3.9%, up from 3.8% in January.
Besides that, we have another inflation report from Europe this morning. The Spanish CPI (consumer price index) report for February is due this morning and expectations are for a three-point jump in February, from 2.8% in January to 3.1% last month.
FED’s Waller will speak later in the US session. Given Federal Reserve Governor Waller’s track record of being an influential voice on changes in Fed policy, his upcoming speech at the Economic Club of New York about the “Economic Outlook” is anticipated with great interest. Waller has previously been a “leading indicator” of shifts in Fed policy, being among the first to discuss Quantitative Tightening (QT) in December 2021 and to mention potential rate decreases in November 2023. In light of the recent high Consumer Price Index (CPI) figures and the Federal Open Market Committee (FOMC) decision, Waller’s remarks are likely to be closely scrutinized by market participants.
Monday was pretty quiet, but the situation improved yesterday, with price action picking up pace down yesterday, particularly in Gold where we saw a $30 jump and a quick reversal down. As a result, there were only two closed forex signals, both of which successfully hit their take profit targets.
Gold Jumps to $2,200 But Returns Back Down
The GOLD price witnessed a significant surge of $30, reaching $2,200 during the European session. However, it promptly retraced back to $2,170 afterward. This price action indicates a consolidation phase, with the XAU/USD pair trading within a narrow range over the past few hours. On the hourly chart (H1), the 200-period Simple Moving Average (SMA) in purple is serving as a support level at the bottom, offering some stability to the price. This suggests that there may be buyers stepping in to support the price near this level. However, further price action will be needed to confirm whether the support holds or if the price breaks below it. Traders will likely monitor this level closely for potential trading opportunities.
XAU/USD – 60 minute chart
USD/CHF Breaks Above 0.90
USD/CHF has been trading on a bearish trend since October 2022, encountering resistance from moving averages, particularly the 50-period Simple Moving Average (SMA). The recent surprise rate cut by the Swiss National Bank (SNB) and the Federal Reserve’s (Fed) stance on monetary policy have had significant impacts on the pair. The SNB’s decision to lower interest rates has softened the Swiss Franc, while the Fed’s stance has strengthened the US Dollar. This dynamic has led to an uptrend in USD/CHF since the beginning of the year. The pair struggled to push above the 50 SMA but managed to do so after the SNB decision and the FOMC meeting, which provided additional bullish momentum. As buyers continue to dominate, USD/CHF has surpassed the 0.90 milestone, indicating further strength in the pair. USD/CHF – Weekly Chart
Cryptocurrency Update
Bitcoin Returns Above $70K
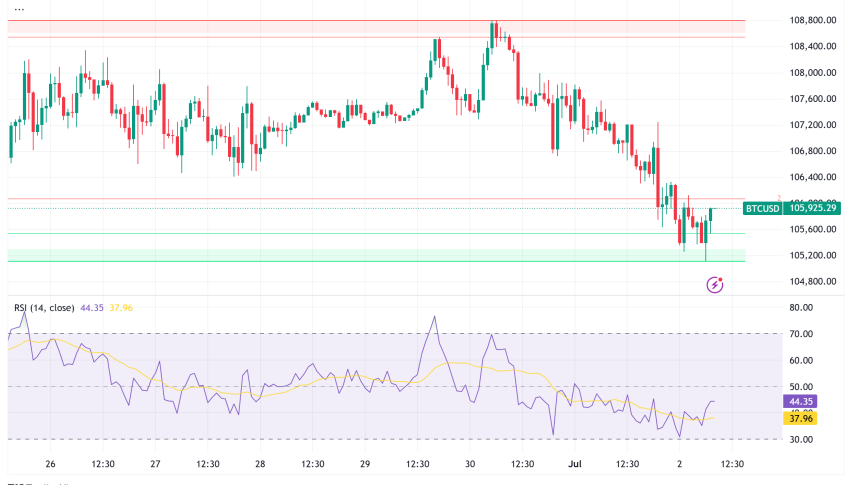
BTC experienced a negative reversal after reaching its peak. Selling pressure caused its price to dip below $65,000 on Saturday. However, there was a reversal in its price trajectory yesterday, with the selloff coming to an end. This brought the price back towards the $70,000 level, indicating renewed buying interest in the cryptocurrency. Despite this, the upward momentum was halted by the 100-period Simple Moving Average (SMA) in green, but the 200-period SMA (purple) held as support and the 100 SMA was broken on Monday, so BTC is above 70K again now. 
BTC/USD – 240 minute chart
The 20 SMA Is Keeping Ethereum Subdued
The ability of ETHEREUM to find support at the 50-period Simple Moving Average (SMA) on the daily chart, depicted in yellow, highlights the significance of this technical level in guiding price movements. Despite experiencing a bearish reversal after surpassing the crucial $4,000 milestone, Ethereum found support at the 50-period SMA, attracting buyers and leading to a subsequent rise in its price. The recent peak at $4,100 further demonstrates the resilience of Ethereum’s upward trend. This resilience is reinforced by its ability to rebound from retracements and consistently find support at key technical levels, indicating a strong bullish sentiment among investors.
ETH/USD – Daily chart
- Check out our free forex signals
- Follow the top economic events on FX Leaders economic calendar
- Trade better, discover more Forex Trading Strategies
- Open a FREE Trading Account


