Shorting AUD/USD and NZD to USD on Solid US Labor Market
The rate of NZD to USD and AUD/USD made a bearish break tonight, breaking important support levels today

The rate of NZD to USD and AUD/USD made a bearish break tonight, breaking important support levels. They retraced higher in the European session but formed bearish reversing setups in the last several hours and it seems like they’re going to begin another bearish leg, with the US GDP report and unemployment claims figure helping the USD in this reversal.
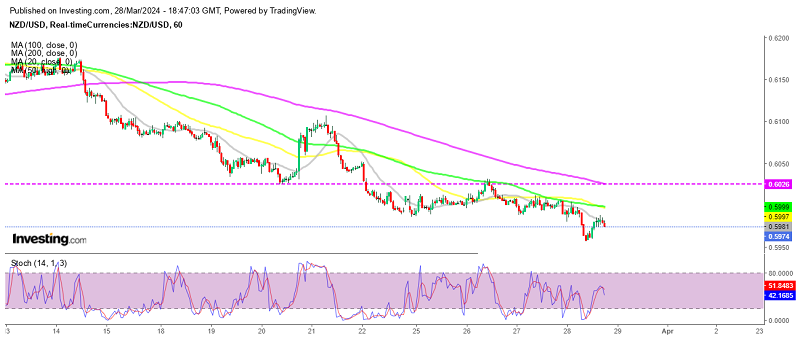
NZD/USD Chart H1 – MAs Keep Pushing the Highs Lower
NZD/USD has lost around 2 cents since the middle of March, which is a steep decline, as markets now expect a less dovish FED, sending the USD higher. Moving averages have been providing resistance and after the break of the support zone at 0.60 today, we decided to open a sell forex signal below this level during this retrace higher, which now seems complete.
AUD/USD Chart H1 – Openign the 2nd Sell Signal Today
AUD/USD has been making lower highs, with moving averages acting as resistance, which confirms the bearish trend, however, buyers were finding support at the area around the 0.65 level. But, this level was broken overnight after some weak economic data from Australia, sending Aussie to 0.6485. But, the price retraced back and faced moving averages again. Another failure followed and now we’re seeing the next reversal down, so we decided to open a sell AUD/UD signal after closing the first one in profit.
Today’s data showed that the Australian Consumer Inflation Expectations decreased from 4.5% to 4.3% in March. This indicates a slight decline in the expected rate of inflation as perceived by consumers. Retail sales in Australia rose by only 0.3% in February, falling short of the expected 0.4% increase. This indicates weaker-than-expected consumer spending, which could be attributed to various factors such as economic uncertainty or changing consumer behavior.
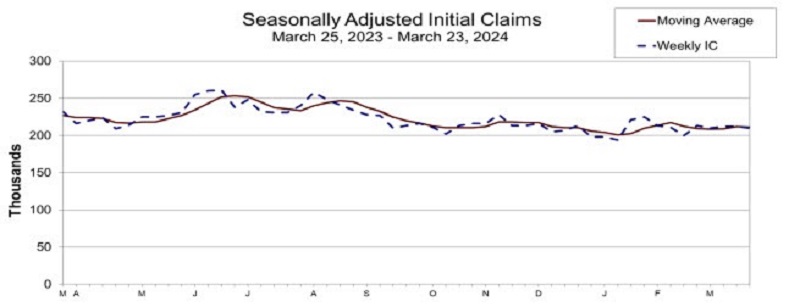
Initial and Continuing Unemployment Claims for Last Week
- Initial jobless claims came in at 210,000, slightly lower than the estimated 212,000. The prior week’s figure was revised to 212,000 from the previously reported 210,000. The 4-week moving average stands at 211,000, consistent with the previous week’s average of 211,750.
- Continuing claims totaled 1.819 million. The previous week’s figure was revised downward by 12,000 to 1.795 million from the previously reported 1.807 million. The 4-week moving average for continuing claims is 1.803 million, compared to the previous week’s average of 1.799 million (revised from 1.802 million).
- The largest increases in initial claims for the week ending March 16 were observed in Missouri (+1,443), Michigan (+1,204), Tennessee (+538), Mississippi (+353), and Arkansas (+279).
- On the other hand, the largest decreases in initial claims were reported in California (-5,794), Oregon (-1,651), Texas (-856), Pennsylvania (-740), and Illinois (-626).
NZD/USD Live Chart
- Check out our free forex signals
- Follow the top economic events on FX Leaders economic calendar
- Trade better, discover more Forex Trading Strategies
- Open a FREE Trading Account


