Ethereum Is Flat; Will Spot ETH ETF Hopes Recharge Bulls?
Ethereum is under pressure, failing to reverse recent losses. As long as prices are below $3,700, ETH bears are in control

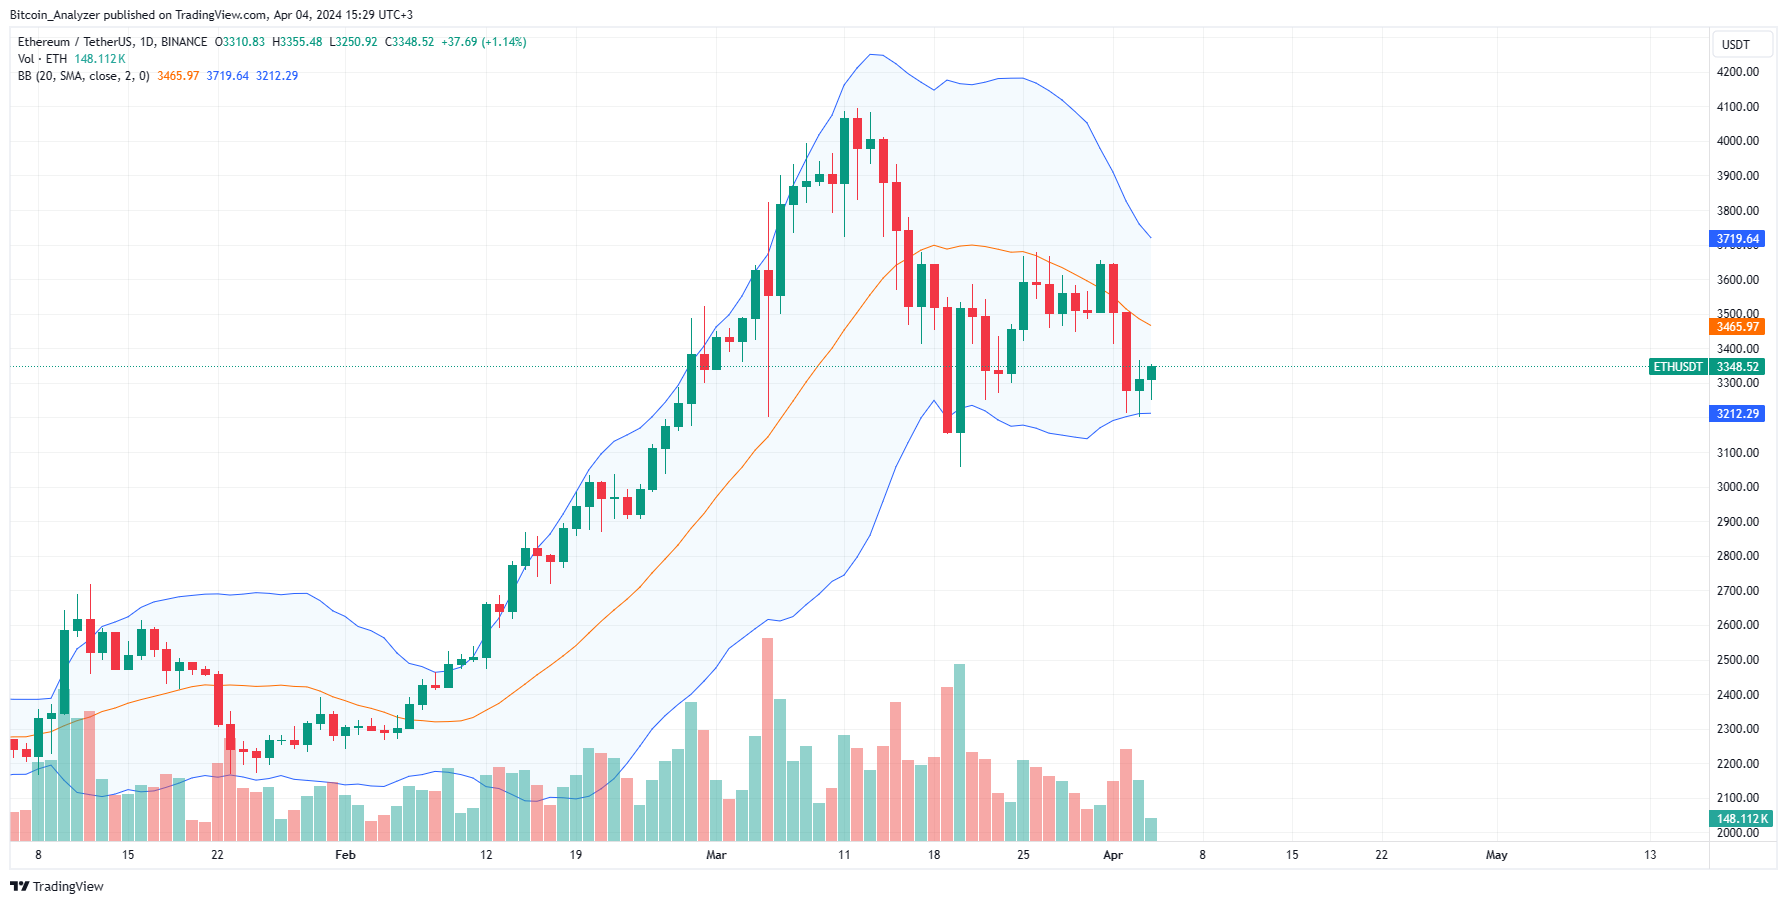
Ethereum is within a bear breakout formation, looking at price action in the daily chart. Even though buyers are optimistic, the failure of bulls to confirm the uptrend and reverse recent losses dampens optimism. In the coming days, ETH might recover. However, for this to happen, there must be a strong bounce from current levels above $3,700, ideally with rising trading volume.
Currently, ETH is flat, adding 1% in the past 24 hours. Over the previous trading week, the coin is down 7%. Sellers remain in charge in the short term as long as prices are within the April 2 bear bar. So far, the average trading volume is the previous day is down 30% to over $13 billion.
In the next 24 hours, the following Ethereum news events might impact prices:
- The United States SEC has opened comments on spot Ethereum ETFs filed by Grayscale, Fidelity, and Bitwise. The public has three weeks to input their comments. This comes as a boost for ETH, a token the regulator, some reports suggest, considered a security.
- Ethereum continues to decentralize. According to trackers, there are now over 1 million validators staking approximately $110 billion worth of ETH. This amount translates to around 26% of the total supply.
Ethereum Price Analysis
ETH/USD momentum is swinging in favor of sellers, looking at the candlestick arrangement in the daily chart.
The wide-ranging bear bar of April 2 still defines the current price action.
Since Ethereum prices are within this range, sellers are in control from an effort-versus-result perspective.
A dump below $3,200 and $3,100 zone, marking March 20 lows, might trigger a sell-off; heaping more pressure on the coin.
On the other hand, a recovery pushing prices above the middle BB and peeling back recent losses might rejuvenate buyers.
A key liquidation level remains at $3,700, above the 20-day moving average.
- Check out our free forex signals
- Follow the top economic events on FX Leaders economic calendar
- Trade better, discover more Forex Trading Strategies
- Open a FREE Trading Account
- Read our latest reviews on: Avatrade, Exness, HFM and XM
Related Articles


Sidebar rates
Related Posts
