GBP/USD Back Up After the Dive From the Strong March NFP
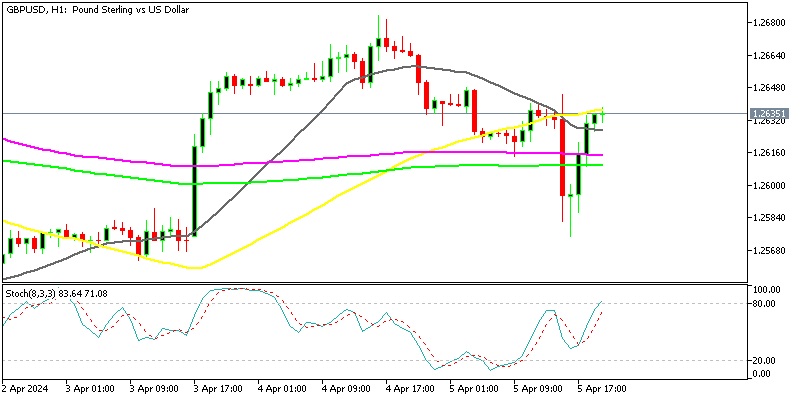
The rate of GBP to USD dipped 70 pip lower after the strong NFP report, but it made a swift reversal and has ended up where it started.

The rate of GBP to USD dipped 70 pip lower after the strong NFP report, but it made a swift reversal and has ended up where it started. While the employment figures were strong, earnings weren’t particularly strong, so traders have reconsidered their positions after the initial USD surge.
GBP/USD Chart H1 – The Price Is Back at the 50 SMA
With no major fundamental drivers from the United Kingdom (UK), the GBP/USD remained largely sensitive to movements in the US Dollar. GBP/USD experienced significant volatility throughout the week, which also continued today. This forex pair initially broke below the moving averages falling to 1.2570s. However, GBP/USD later rebounded to climb just below the 50 SMA (yellow). This fluctuation in price was primarily influenced by market speculations regarding a potential hawkish policy reversal by the US Federal Reserve (Fed) and postponing the June rate cut after such strong numbers.
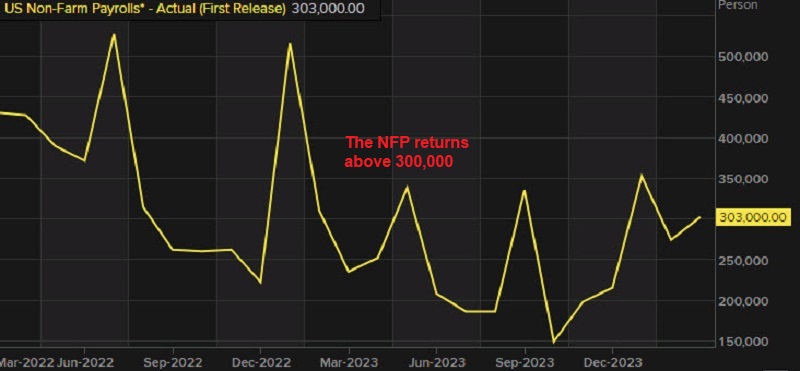
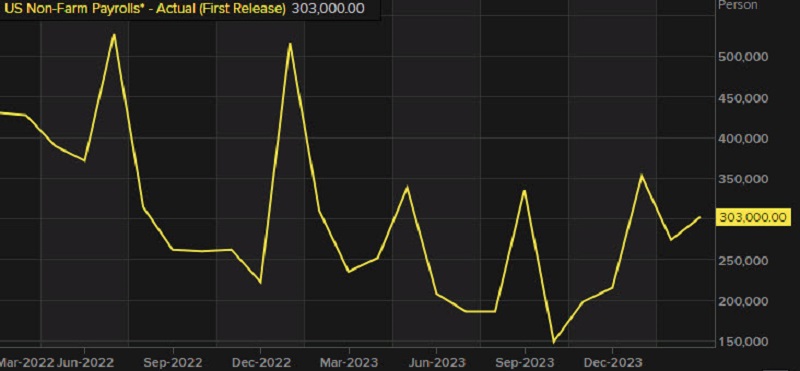
The US non-farm payrolls report for March exceeded expectations, with job growth reaching +303,000 compared to the expected +200,000. The prior month’s figure was also revised upward to +270,000 from +275,000. The unemployment rate fell to 3.8% from the expected 3.9%, with the participation rate rising to 62.7% from the prior 62.5%. The U6 underemployment rate remained unchanged at 7.3%.
March 2024 US Employment Data from the Non-Farm Payrolls NFP Report
- US March non-farm payrolls +303K vs +200K expected
- February non-farm payrolls Prior +275K (revised to +270K)
- Two-month net revision +22K vs -167K prior
- Unemployment rate: Decreased to 3.8% from the expected 3.9%, indicating a stronger labor market than anticipated. The prior unemployment rate was 3.9%.
- Participation rate: Increased to 62.7% from the prior 62.5%, suggesting more people entering or rejoining the labor force.
- U6 underemployment rate: Remained unchanged at 7.3% from the prior month.
- Average hourly earnings: Rose by 0.3% month-on-month, meeting expectations. However, the unrounded figure of 0.347% indicates slightly higher growth. Prior average hourly earnings were revised upwards to +0.2% from +0.1%.
- Average hourly earnings (year-on-year): Held steady at 4.1%, in line with expectations.
- Average weekly hours: Increased slightly to 34.4 from the expected 34.3.
- Change in private payrolls: Showed robust growth of 232,000, surpassing the expected 160,000.
- Change in manufacturing payrolls: Remained flat at 0, falling short of the expected increase of 5,000.
- Household survey: Showed a significant increase of 498,000 compared to the prior 63,000
The March non-farm payrolls report indeed delivered impressive figures, potentially delaying the timing of the first interest rate hike, as suggested by some Federal Reserve members following the release. Despite this, the overall backdrop remains supportive of a Fed cut, indicating that the central bank will intervene to support the economy if needed, if not in June, then in July.
Additionally, there is increasing attention on immigration, with discussions revolving around the significant job growth observed over the past year, which may be partially attributed to more people entering the country than official figures indicate. So after the 70 pip drop in GBP/USD after the strong employment figures, the price reversed back up, erasing all the losses.
Earnings, particularly average hourly wages which are closely watched by market participants came as expected. The consensus expectation for a 0.3% increase underscores the significance of this metric. Even slight deviations from this consensus, such as 0.26% versus 0.34%, can carry meaningful implications for market sentiment and monetary policy expectations. Therefore, investors will be closely analyzing this data point down to the second decimal point.
GBP/USD Live Chart
- Check out our free forex signals
- Follow the top economic events on FX Leaders economic calendar
- Trade better, discover more Forex Trading Strategies
- Open a FREE Trading Account


