Gold Price Hits $2,353 Amid Fed Rate Cut Hints and China’s Buying Spree
Gold has reached unprecedented levels, touching $2,353, despite a robust US dollar. This rally is propelled by the anticipated Federal
Gold has reached unprecedented levels, touching $2,353, despite a robust US dollar. This rally is propelled by the anticipated Federal Reserve rate cuts and China’s aggressive gold acquisition strategy. With the Fed likely to reduce rates in 2024, investors find gold increasingly attractive, given its inverse relationship with interest-bearing assets.
Federal Reserve’s Rate Strategy and Gold’s Lure
The prospect of the Fed easing monetary policy next year enhances gold’s allure. Lower interest rates generally devalue the dollar, heightening gold’s appeal globally.
However, recent robust US job figures and revised Fed rate cut expectations have curbed gold’s ascent, emphasizing the market’s sensitivity to monetary policy signals.
China’s Persistent Gold Purchases Amplify Market Optimism
China’s central bank, through its continued gold reserve expansion for the 17th month, has reinforced gold’s demand. This persistent institutional buying underscores gold’s enduring value and diversification benefits, contributing significantly to its price surge.
Geopolitical Developments and Market Dynamics
Easing tensions in the Middle East, particularly with Israel’s conciliatory moves in Gaza, have somewhat mitigated global risk concerns. This shift has sparked a positive market sentiment, reducing the immediate rush for safe-haven assets like gold.
However, gold’s price trajectory remains influenced by a complex interplay of interest rate forecasts, geopolitical shifts, and major economic indicators.
Gold Price Forecast: Technical Outlook
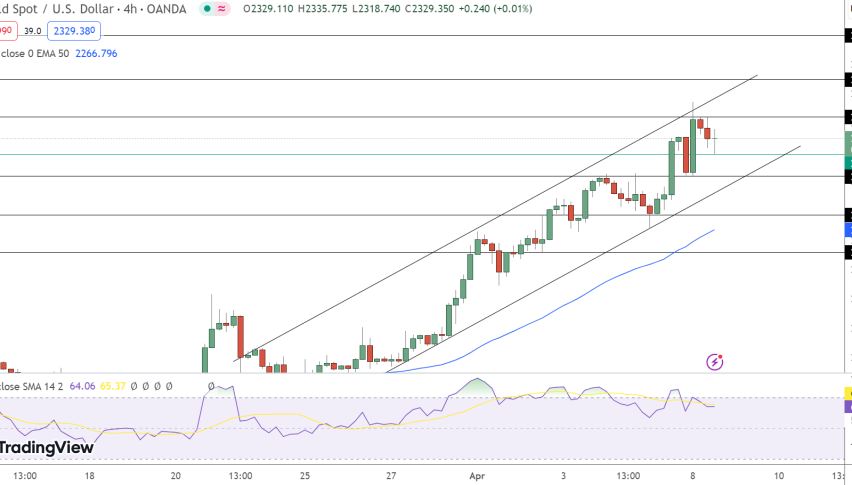
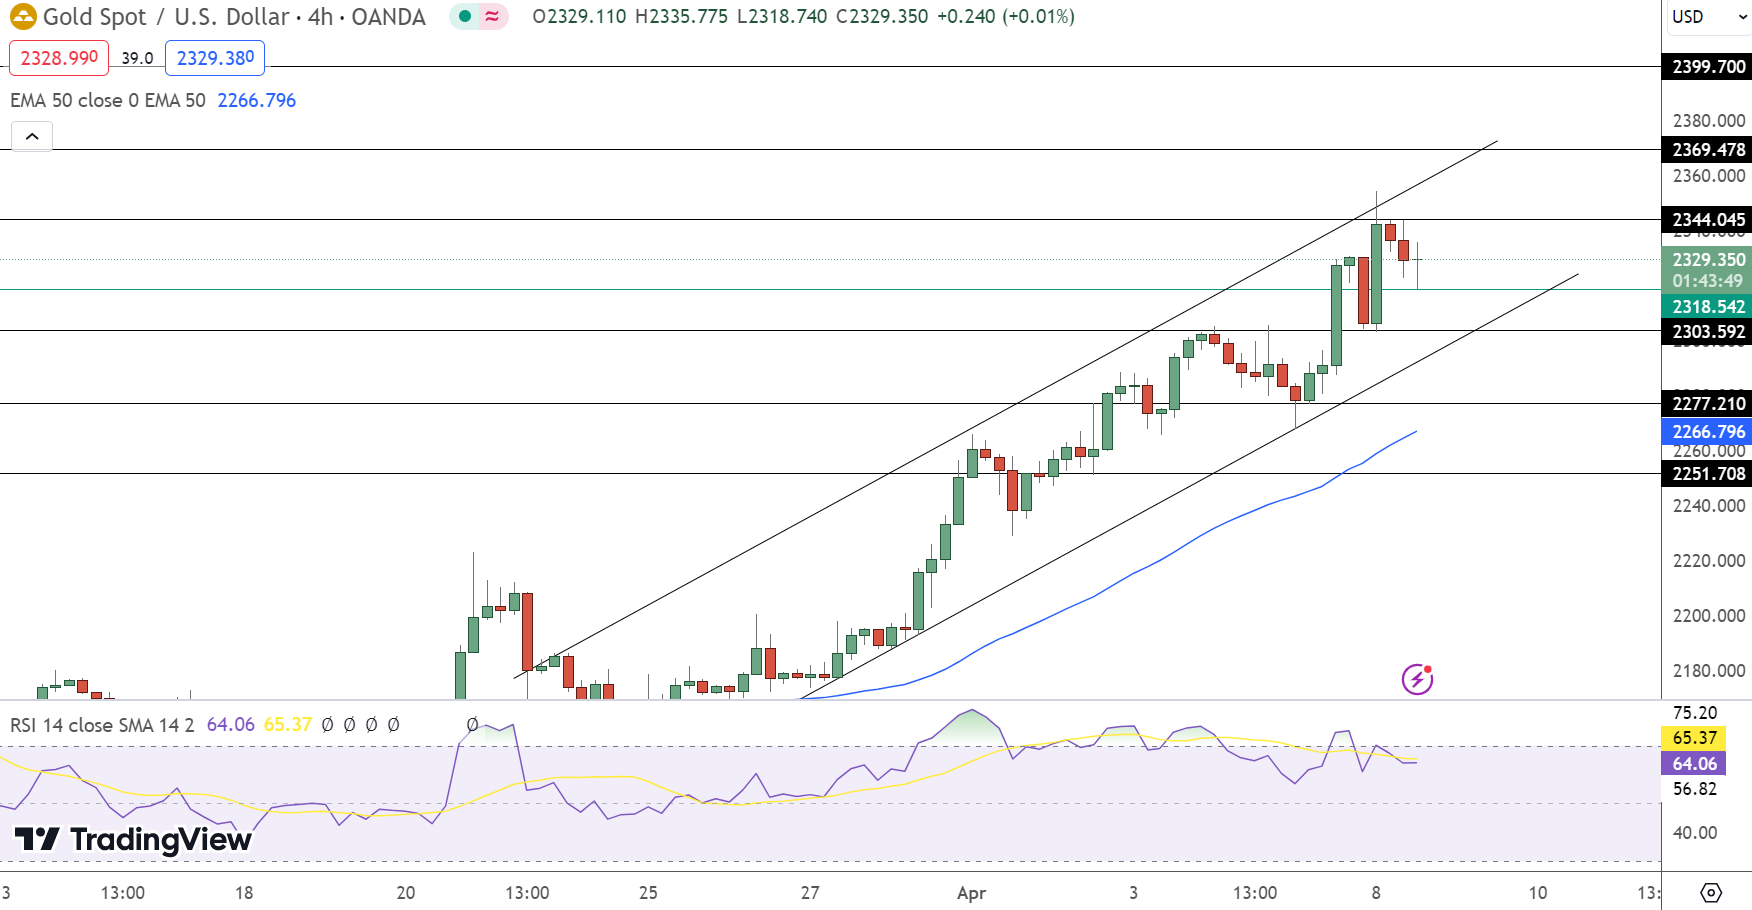
On April 8, Gold witnessed a minor retracement, closing at $2329.35, a slight decline of 0.05%. The technical chart reveals pivotal support at $2319, marking the current session’s baseline.
Resistance levels are staggered at $2344, $2369, and $2400, whereas support levels are observed at $2304, $2277, and $2252. The Relative Strength Index (RSI) stands at 64, indicating a bullish momentum as it leans towards overbought territory.
The 50-day Exponential Moving Average (EMA) at $2267 corroborates this uptrend, reinforcing the bullish sentiment. Should Gold breach the pivot point of $2319, it may trigger a swift downward movement.
- Check out our free forex signals
- Follow the top economic events on FX Leaders economic calendar
- Trade better, discover more Forex Trading Strategies
- Open a FREE Trading Account
- Read our latest reviews on: Avatrade, Exness, HFM and XM
Related Articles


Sidebar rates
Related Posts
