Nvidia Stock Below $850 as S&P 500 and Dow Jones Retreat
Stock markets have had an amazing rally since October, with Nvidia stock (NVDA) heading to $1,000 twice in March, but are under pressure now
Stock markets have had an amazing rally since October, with Nvidia stock (NVDA) heading for $1,000 twice in March, but they are under pressure this week. The Nvidia price has tumbled more than $40 only today, slipping below $850 as risk sentiment remains negative in financial markets.
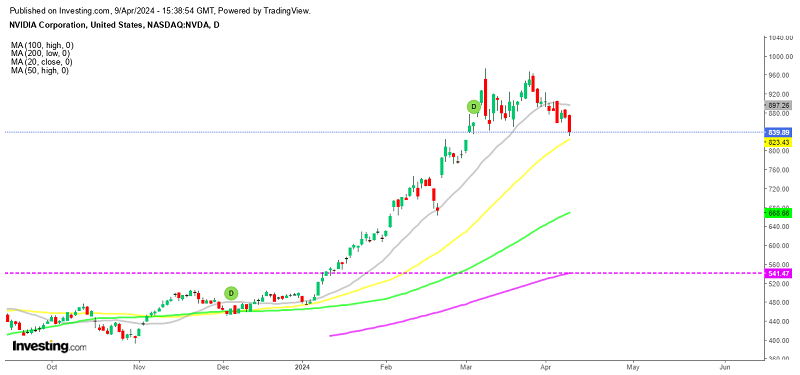
Nvidia Chart Daily – Will the 50 SMA Hold As Support?
The decline in Nvidia shares by about 5% to $830, down by around $140, is attributed to comments from a UK analyst expressing cautious sentiment towards semiconductor stocks, including Nvidia. From a technical perspective, the current price level is the lowest since February, when it formed a resistance zone around $820s.
Notably, the price has dropped below its 20 daily moving average (gray) for the first time since early January, which is a significant technical indicator holding as support for several months. The 20 SMA is currently at $895. Last week, the price fell below this moving average, and this indicator has now turned into resistance, which indicates that sellers are in control currently.
S&P 500 Chart Daily – The 20 SMA Has Been Broken To resume the bullish trend, the Nvidia stock price would need to climb above the 20 SMA, but first, we need the 50 SMA (yellow) to hold as support on the daily chart. If it does, then we’re likely to see a bounce soon. The S&P500 has also been finding support at the 20 SMA, but it has broken below this moving average. However, the price is not falling too far from it, so the upside should resume soon and I think that we might go long on one of the main indices.
S&P 500 Live Chart
- Check out our free forex signals
- Follow the top economic events on FX Leaders economic calendar
- Trade better, discover more Forex Trading Strategies
- Open a FREE Trading Account
- Read our latest reviews on: Avatrade, Exness, HFM and XM
Related Articles
Sidebar rates
Related Posts
