Ethereum and Bitcoin Price Fall 7-10%, After Forming A Top
Ethereum and the Bitcoin price saw some strong demand early this year, but we might be witnessing a top in both the BTC and ETH now.
Ethereum and the Bitcoin price saw some strong demand early this year, with BTC pushing above $73,000 while ETH climbed above $4,000 in early March. However, they haven’t had new highs for about a month and in fact, the highs have been getting lower, which means that there is a top in place in both cryptocurrencies.
Bitcoin Chart Daily – The 50 SMA Held As Support

BITCOIN experienced a massive surge in the first two months of 2024, but has formed a resistance zone between $72,000 and $73,000, with the lows still getting higher, which shows that in the long term, buyers are in charge. However, BTC had a challenging day on Friday, with prices dropping nearly 7% to reach a low of $65,220. However, the cryptocurrency has since rebounded slightly, finding support from this month’s low. The upcoming halving, expected around April 20, is anticipated by Bitcoin bulls to act as a catalyst for price movement.
This event, which involves a reduction in the reward given to Bitcoin miners for validating transactions, has historically been associated with increased scarcity and upward price pressure. Despite the anticipation surrounding the halving, the technical analysis of Bitcoin’s price action suggests some fears following this period of consolidation. So, we’re gonna have a breakout soon, either higher if buyers push above the resistance or lower, but sellers will have to break the 50 SMA (yellow).
Ethereum Chart Daily – The 50 SMA Has Been Broken Here

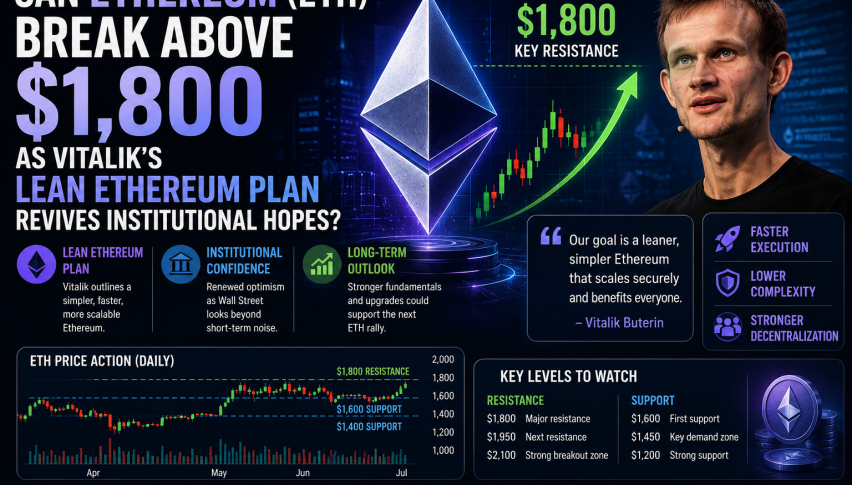
ETHEREUM also enjoyed some decent demand earlier this year, climbing above $4,000. But it has failed to reclaim that major level and the price has slipped below the 50 SMA on the daily chart. Today we saw an 11% decline as ETYH/USD fell below $3,100, despite positive Ethereum news this week.
The Financial Report for the first quarter of this year from the Ethereum blockchain showed a notable uptick in revenue measures. Fees and sales surged by 80% from Q4 of 2023, demonstrating a substantial increase in revenue. Moreover, profitability tripled during the same period, indicating improved financial performance for the network.
This financial momentum is largely in line with significant advancements observed in network and ecosystem metrics. During this period, the Ethereum blockchain processed over 100 million transactions, reflecting heightened user engagement and activity. Additionally, almost 10 million new addresses were created during the same period, suggesting increased adoption and expansion of the Ethereum ecosystem.
Ethereum ETF in Hong Kong on Monday?
Three Chinese asset management firms, namely Harvest Fund Management, Bosera Asset Management, and HashKey Capital, are anticipated to get regulatory approval for exchange-traded funds (ETFs) that follow the top two digital assets, Ethereum and Bitcoin. An Ethereum ETF is expected to be approved as early as Monday in Hong Kong. Additionally, spot Ethereum and Bitcoin ETFs may obtain approval in Hong Kong around the same time. If these approvals are granted, it would be a significant milestone in the cryptocurrency market, providing investors with more accessible and regulated channels to invest in digital assets.
Bitcoin Live Chart
- Check out our free forex signals
- Follow the top economic events on FX Leaders economic calendar
- Trade better, discover more Forex Trading Strategies
- Open a FREE Trading Account
- Read our latest reviews on: Avatrade, Exness, HFM and XM
Related Articles

Sidebar rates
Related Posts
