Forex Signals Brief April 15: Will US Retail Sales Offer A Surprise Today?
The week starts with a major release, such as the US retail sales and Empire State manufacturing

Last week we had three major central bank meetings, however, the US CPI inflation released on Wednesday took all the attention. It came above expectations once again, with the headline CPI increasing to 3.5% in March from 3.2% in February, sending the USD 200 pips higher across the board until the end of the week.

However, the PPI (producer price index) report on Thursday was softer, which cooled off some inflation fears. Regarding central banks, the Reserve Bank of New Zealand, the Bank of Canada, and the European Central Bank left interest rates unchanged at 5.50%, 5.00% and 4.50% respectively. However, their rhetoric turned even more dovish apart from the RBNZ, leaving the Euro and the CAD vulnerable all week.
This Week’s Market Expectations
This week we have many CPI (Consumer Price Index) reports for March, which will give a broader picture of the inflation trend. Today it starts with US retail sales numbers which are expected to remain stable compared to February, but there might be a surprise, so we will be following this report later on.
Here’s a breakdown of the upcoming events in the financial markets:
Monday:
- New Zealand Services PMI: A gauge of business sentiment and activity in the services sector in New Zealand.
- Eurozone Industrial Production: Measures the change in the total inflation-adjusted value of output produced by manufacturers, mines, and utilities in the Eurozone.
- US Retail Sales: Provides insight into consumer spending patterns by measuring the total sales of goods and services at the retail level in the United States..
- PBoC MLF: People’s Bank of China Medium-term Lending Facility, which provides liquidity to commercial banks in China.
Tuesday:
- China Industrial Production and Retail Sales: Key indicators of economic activity and consumer spending in China.
- UK Labour Market report: Provides data on employment levels, unemployment rates, and wage growth in the United Kingdom.
- Eurozone ZEW: The ZEW Economic Sentiment Indicator for the Eurozone, reflects the expectations of financial experts regarding the economic outlook.
- Canada CPI: Measures changes in the price level of a basket of consumer goods and services purchased by households in Canada.
- US Housing Starts and Building Permits: Indicates the number of new residential construction projects started and the number of permits issued in the United States.
Wednesday:
- New Zealand CPI: Measures changes in the price of goods and services purchased by households in New Zealand.
- UK CPI: Measures changes in the price level of a basket of goods and services purchased by households in the United Kingdom.
Thursday:
- Australia Labour Market report: Provides data on employment levels, unemployment rates, and wage growth in Australia.
- US Jobless Claims: Indicates the number of individuals who filed for unemployment insurance for the first time in the United States.
Friday:
- Japan CPI: Measures changes in the price level of a basket of goods and services purchased by households in Japan.
- UK Retail Sales: Provides data on the total sales of goods by retailers in the United Kingdom
last week the US Dollar turned bullish, following the strong CPI inflation report on Wednesday, and ended up more than 2 cents higher against most major currencies. We opened 16 trading signals in total, ending up with 4 losing ones and 12 winning forex signals in total.
The 50 SMA Keeping Gold Bullish
Gold made a dramatic reversal on Friday after reaching a new record high of $2,430. The upward momentum underscores the ongoing demand and interest from investors in gold as a safe-haven asset. The price retreated $100 lower in the US session, however, the 50 SMA (yellow) stopped the decline and last night XAU opened with a bullish gap higher at $2,360.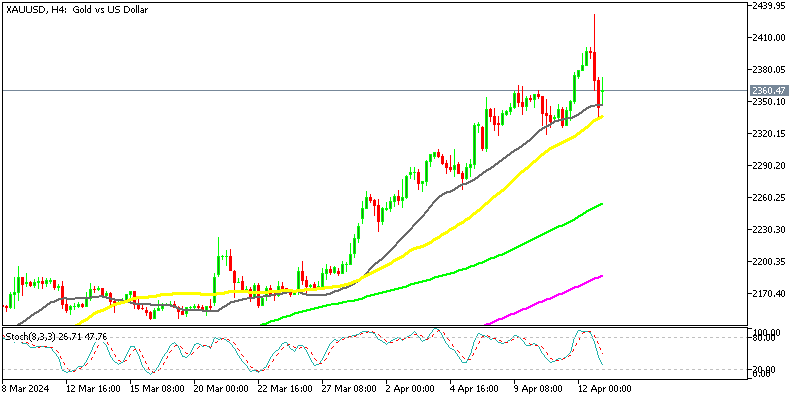
XAU/USD – 240 minute chart
EUR/USD Breaks Below the 1.07 Support
The EUR/USD currency has been maintaining gains above 1.07 for the last two months, but last week we saw a significant negative move, and 1.05 now appears to be within reach. The technical chart shows a negative reversal pattern, and the fundamentals are also going bearish for this pair, creating a toxic mix for buyers. The euro fell sharply in the second half of the week, owing mostly to a hawkish Federal Reserve and a dovish European Central Bank (ECB). This disparity in monetary policy stances has resulted in a significant decline in the EUR/USD exchange rate, with the pair losing more than 2 cents this week.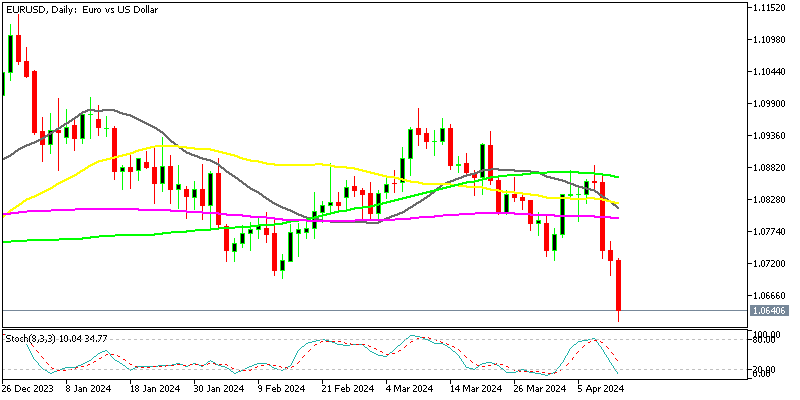
EUR/USD – Daily Chart
Cryptocurrency Update
Bitcoin Moves Above $70K Again
The positive momentum in Bitcoin (BTC) persists, with buyers consistently stepping in to purchase during price declines. Despite occasional pullbacks, buyers have shown resilience, continuously driving the price higher. Last week we saw a strong retreat lower in BTC/USD, sending it around $10k lower. However, the support zone above $60,000 held the decline and yesterday the price already started to bounce higher.
BTC/USD – Daily chart
Ethereum Consolidates Around $3,500
Ethereum (ETH) has encountered support around the 50-period Simple Moving Average (SMA), depicted by the yellow line, which has somewhat halted its upward momentum. The 50-period SMA is currently acting as a barrier, suggesting either persistent buying pressure or a lack of selling momentum to push Ethereum’s price beyond this level. Additionally, a bearish reversal occurred late last week, causing the price to dip close to $3,000 before rebounding above the March lows. These technical dynamics indicate a tug-of-war between buyers and sellers in the Ethereum market. The 50-period SMA is providing support, while the 20-period SMA may be acting as resistance. As you are already long on ETH/USD, it is crucial to actively monitor these moving averages and price levels for any shifts in market sentiment and direction.
ETH/USD – Daily chart
- Check out our free forex signals
- Follow the top economic events on FX Leaders economic calendar
- Trade better, discover more Forex Trading Strategies
- Open a FREE Trading Account
- Read our latest reviews on: Avatrade, Exness, HFM and XM
Related Articles


Sidebar rates
Related Posts
