Forex Signals Brief April 16: Central Bankers Meeting in Washington!
Today we have the Chinese GDP, UK Employment and Canada CPI, but central bankers will likely move market most in the evening.

Yesterday’s highlight was the robust performance of March U.S. retail sales, which surged by 0.7%, surpassing expectations of a 0.3% increase. This marked a significant improvement compared to previous months when retail sales were lackluster. Excluding auto sales, the increase was even more impressive at 1.1%, more than doubling the anticipated 0.5% and surpassing the previous month’s 0.3%.

The control group, which offers a more refined estimate by excluding volatile items like automobiles, gasoline, building materials, and food services, also saw a strong increase of 1.1%, significantly exceeding the projected 0.4%. The announcement of stronger-than-expected retail sales in March contributed to rising yields and declining equities, driven by a combination of higher rates and geopolitical tensions following Iran’s military escalation against Israel over the weekend.
Reports of potential retaliation from Israel sparked market concerns. In addition, the regional Empire manufacturing report disappointed, registering at -14.3 compared to the predicted -7.5. This adds to the mix of economic data influencing market sentiment, with other regional indices scheduled for release in the coming weeks to provide a more comprehensive overview of nationwide manufacturing activity.
Today’s Market Expectations
Today opened with a round of important data from China. The Q1 2024 GDP growth exceeded expectations, coming in at 5.3% year-on-year, up from the previous reading of 5.2%. Quarter-on-quarter GDP growth also showed improvement, reaching +1.6%, compared to the previous figure of +1.0%. However, March industrial output grew by 4.5% year-on-year, falling short of expectations of +5.4%. Retail sales in March also missed expectations, rising by 3.1% compared to the anticipated 4.5%. Property investment year-to-date (YTD) saw a decline of 9.5% year-on-year, slightly more than the expected -9.2%, and up from the previous -9.0%. Residential property sales YTD decreased by 30.7% year-on-year, showing a slight improvement from the previous -32.7%. Industrial production YTD increased by 6.1% year-on-year, slightly exceeding expectations of 6.0%, but down from the previous 7.0%. Retail sales YTD rose by 4.7% year-on-year, a decrease from the previous +5.5%.
The UK employment rate projection was that the unemployment rate would tick higher to 4.0% in March from 3.9% in Ferbuary. The primary focus will be on wage growth indicators, which are closely watched for insights into the health of the labor market and potential inflationary pressures. However, barring any major surprises in the data, market pricing is expected to remain relatively unchanged as investors await the release of the UK Consumer Price Index (CPI) report the following day.
The upcoming Canadian Consumer Price Index (CPI) readings are anticipated to show a monthly increase of 0.7% and a year-on-year inflation rate of 3.0% for March. This projection represents a slight decrease from the February inflation rate of 3.1%. Key measures of underlying inflation, such as the Median CPI and Trimmed CPI, are expected to remain stable at 3.2% and 3.1% year-on-year, respectively. The focus will be on these underlying inflation measures, as they provide insight into the true inflationary pressures in the economy, which is of particular concern to the Bank of Canada (BoC). In its recent monetary policy meeting, the BoC omitted a phrase from its statement expressing concern about the inflation forecast, which was interpreted as a dovish signal. Given the recent weak labor market and inflation reports, there are expectations in the market that the BoC may lower interest rates in June. However, for the central bank to follow through with such a decision, it will likely require the disinflationary trend to continue as anticipated.
However, the most important event and the most action in the markets will come in the evening when a plethora of central bankers will deliver speeches from Washington DC. We will have several speeches from BOE Gov Bailey, BOC Gov Macklem Speaks, Fed Chair Powell etc.
last week the US Dollar turned bullish, following the strong CPI inflation report on Wednesday, and ended up more than 2 cents higher against most major currencies. We opened 16 trading signals in total, ending up with 4 losing ones and 12 winning forex signals in total.
Gold Continues to Remain Supported During Pullbacks
Gold experienced a significant reversal on Friday after hitting a new record high of $2,430. This reversal suggests a pullback in the increasing momentum that had been driving gold prices higher. Despite the decline of $100 during the US session, the 50-day Simple Moving Average (SMA), represented by the yellow line, acted as a support level, preventing further losses. As a result, gold began the next session with a bullish gap upward at $2,360, indicating renewed buying interest. This price action underscores the ongoing demand for gold as a safe-haven asset, despite the temporary setback.
XAU/USD – 60 minute chart
EUR/GBP Finds Support at the 50 SMA
EUR/GBP has shown stability since the end of January, with its movement confined within a narrow one-cent range, fluctuating between 0.65 and 0.66. This consolidation pattern has persisted amid the influence of the Bank of England (BOE) and the European Central Bank (ECB) on the currency pair. However, recent Eurozone data, particularly the return to expansion of Eurozone Industrial Production reported today, has provided some positive signals. As a result, the EUR/GBP pair has experienced a slight bullish move this week, gaining about 50 pips. On the daily chart, the pair has been trading between the 50-day Simple Moving Average (SMA) acting as support (represented by the yellow line) and the 100-day SMA serving as resistance (depicted by the green line). This indicates a tug-of-war between buyers and sellers, with the moving averages acting as key levels to watch for potential breakout or reversal signals.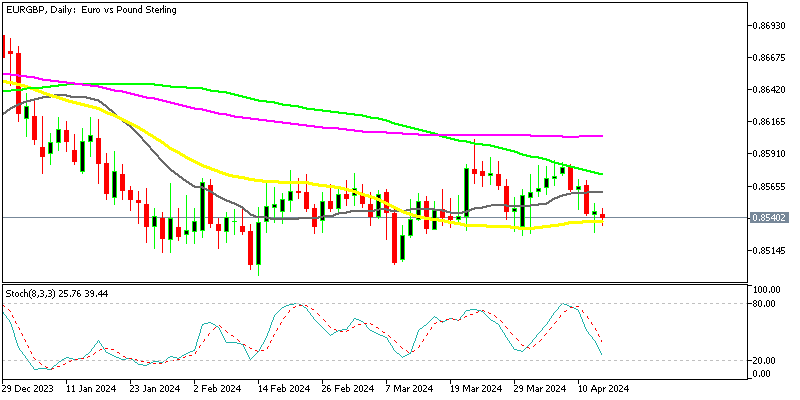
EUR/USD – Daily Chart
Cryptocurrency Update
Bitcoin Moves Above $70K Again
The upward momentum in Bitcoin (BTC) persists despite the recent consolidation. The upside momentum is characterized by buyers stepping in to purchase during price declines. Despite occasional pullbacks, buyers have shown resilience, consistently pushing the price higher. Last week, BTC/USD witnessed a notable decline, dropping by approximately $10,000. However, the support zone above $60,000 prevented further losses, and the price started to rebound on Sunday. Yesterday we saw another decline though, so we’ll see if the $60K level holds.
BTC/USD – Daily chart
Ethereum Consolidates Around $3,500
The 50-period Simple Moving Average (SMA) has emerged as a support level for Ethereum (ETH), as indicated by the yellow line, slowing down its upward trajectory. Currently, the 50-period SMA acts as a barrier, suggesting that sustained buying pressure or a lack of selling momentum may propel Ethereum’s price beyond this level. Additionally, a bearish reversal occurred late last week, pushing the price down to around $3,000 before rebounding above the March lows. These technical patterns suggest a battle between buyers and sellers in the Ethereum market, with the 50-period SMA providing support and the 20-period SMA potentially serving as resistance.
ETH/USD – Daily chart
- Check out our free forex signals
- Follow the top economic events on FX Leaders economic calendar
- Trade better, discover more Forex Trading Strategies
- Open a FREE Trading Account
- Read our latest reviews on: Avatrade, Exness, HFM and XM
Related Articles


Sidebar rates
Related Posts
