Ethereum Crashes 25%, Traders Cutting Exposure As Spot ETF Hopes Dim
Ethereum has been unable to reverse losses of last weekend as hopes of a spot ETH ETF dim. Bulls are capped at $3,300

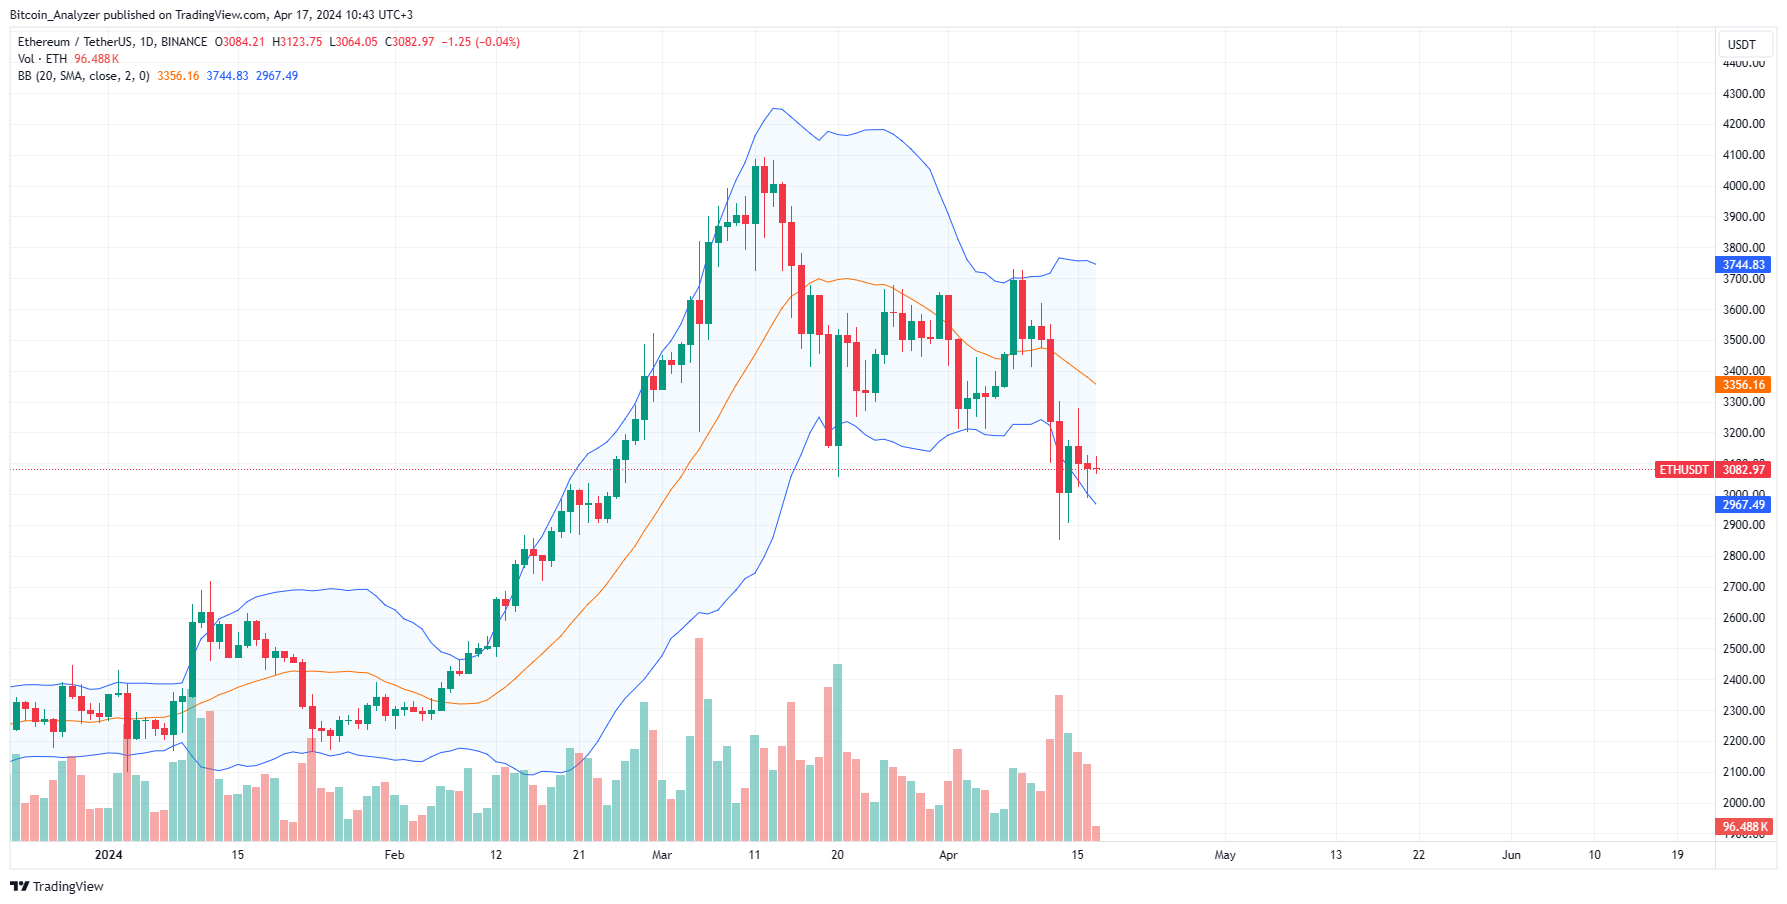
Ethereum remains under immense selling pressure, looking at the formation in the daily chart. Even though traders are generally upbeat, citing on-chain developments and continuous platform development, price action points to a different story.
Presently, ETH is down 25% from 2024 highs, retesting the 50% Fibonacci retracement level of the October to March trade range. Technically, buyers have a chance, but there must be solid movements above the immediate liquidation zone for the uptrend to be confirmed.
Major Ethereum news in the past 24 hours include:
- Perpetual derivatives data shows that traders appear to be decreasing their exposure, chopping down their positions as they de-risk. The more traders exit, the higher the odds of Ethereum prices slipping below the psychological $3,000 level.
- Even with Hong Kong’s SFC approving multiple spot Ethereum ETFs for several applicants, there are doubts about whether the United States SEC will green-light this product. Over the past few months, even amid rising ETH prices, Gary Gensler has failed to clarify whether the coin is a commodity like Bitcoin. This doubts whether this complex derivative will get the nod in May.
Ethereum Price Analysis
ETH/USD is under immense selling pressure per the formation in the daily chart.
The breakout of April 13 is clear, swinging price action in favor of sellers.
Accordingly, Ethereum traders might search for entries, targeting $3,000 and lower as long as the coin is trading below $3,300.
The ideal bear target will be $2,600, or January 2024 highs.
This outlook will, however, change if bulls flow back, breaking above $3,300 and the current sideways movement in lower time frames.
Even so, for risk-averse traders, a clean break above $3,700 will cancel out bears, allowing buyers to build momentum for a rally towards $5,000—or higher.
- Check out our free forex signals
- Follow the top economic events on FX Leaders economic calendar
- Trade better, discover more Forex Trading Strategies
- Open a FREE Trading Account
- Read our latest reviews on: Avatrade, Exness, HFM and XM
Related Articles


Sidebar rates
Related Posts
