Forex Signals Brief April 17: Inflation Continues to Fall Globally
New Zealand and UK CPI YoY have already been released and they posted another slowdown today

Yesterday the Q/Y Chinese GDP showed an increase while expectations were for a slowdown, while Industrial Production and Retail Sales did slow down more than expected. That left the risk sentiment mixed for most of the day, with stock markets mixed, as well as commodity currencies.

The UK Unemployment Rate increased more than expected, but the Average Earnings Index also increased, which balanced each other out. The Canadian CPI inflation also came on the softer side despite an increase in the headline number, which sent the CAD around 70 pips lower.
Later in the evening, Chair Powell of the Federal Reserve has shifted his stance, highlighting the persistent lack of progress on inflation despite the strong performance of the U.S. economy. Recent data suggests that core PCE inflation for March is expected to stabilize around 2.8%. Powell noted that while wage pressures are easing gradually, the labor market remains robust and is moving towards a healthier equilibrium. However, the data do not warrant a more aggressive approach to managing inflation. Powell emphasized the Fed’s cautious stance, particularly in avoiding overreactions to inflationary declines observed in the previous year.
In a recent CNBC interview, European Central Bank President Christine Lagarde suggested that interest rates are likely to be lowered soon, barring any significant unforeseen developments. She noted that the ECB’s anticipated disinflationary trend is unfolding and that geopolitical events have not yet had a substantial impact on commodity prices. This statement indicates a potential shift towards a more accommodative monetary policy in the Eurozone to address economic challenges and support inflationary objectives.
Today’s Market Expectations
Today opened with the New Zealand inflation data for the January-March quarter of 2024 which revealed that the Consumer Price Index (CPI) rose by 0.6% quarter-on-quarter (q/q), matching expectations and slightly higher than the Q4 of 2024 CPI of 0.5%. On a year-on-year (y/y) basis, inflation stood at 4.0%, marking the lowest level since 2021 but still significantly above the Reserve Bank of New Zealand’s (RBNZ) target. This figure was in line with expectations but lower than the previous reading of 4.7%, which shows that the declining trend continues.
The upcoming UK Consumer Price Index (CPI) data is anticipated to show a month-on-month (M/M) measure of 0.4%, compared to the previous figure of 0.6%. Meanwhile, the year-on-year (Y/Y) CPI is expected to be 3.1%, down from the prior reading of 3.4%. Core CPI, which excludes volatile food and energy prices, is forecasted to be 4.3%, a decrease from the previous 4.5%. Of particular concern to the Bank of England (BoE) is the Services Inflation rate, currently at a worrisome level of 6.1%. The possibility of a rate cut in June is estimated to be around 50/50, but the BoE may not act unless there is a notable deceleration in inflation in the coming months, particularly within the services sector, or if there is a contraction in the labor market in the interim.
Yesterday the US Dollar pushed higher against most major currencies but then gave it back, so most major pairs traded in a range. We opened 6 trading signals in total, ending up with 3 losing ones and 2 winning forex signals in total after getting caught up in the volatility and the bounces.
MAs Keeping Gold Bullish
Gold reached a new record high of $2,430 on Friday before experiencing a significant reversal. This reversal suggests a pullback from the upward momentum that had been driving the price of gold higher. Despite a $100 decline during the US session, the 50-day Simple Moving Average (SMA), depicted by the yellow line, provided support, limiting further losses. Subsequently, gold opened the next session with a bullish gap upward at $2,360, indicating renewed buying interest. This price movement highlights the persistent demand for gold as a safe-haven asset, despite the temporary setback.
XAU/USD – 240 minute chart
NZD/USD Testing MAs After the Inflation Report
NZD/USD experienced a significant decline following another robust US CPI report, as evidenced by the H1 chart above, ultimately reaching a critical support zone near the 0.5870 level. However, we saw another dip last night after the CPI report, which took the price to 0.5860. In anticipation of a potential rally towards the trendline, buyers may enter the market, placing their stop-loss orders below this zone to manage their risk. On the other hand, sellers aiming to strengthen their bearish positions at 0.5900-20 would require a further decline in price, potentially necessitating a lower price break.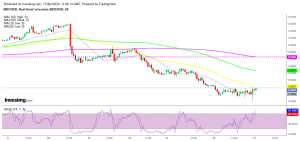
NZD/USD – 60 minute Chart
Cryptocurrency Update
Bitcoin COntinues to Consolidate Between 60k and 70K
The upward momentum in Bitcoin (BTC) persists despite the recent consolidation. The upside momentum is characterized by buyers stepping in to purchase during price declines. Despite occasional pullbacks, buyers have shown resilience, consistently pushing the price higher. Last week, BTC/USD witnessed a notable decline, dropping by approximately $10,000. However, the support zone above $60,000 prevented further losses, and the price started to rebound on Sunday. Yesterday we saw another decline though, so we’ll see if the $60K level holds.
BTC/USD – Daily chart
Ethereum Finds Support at the 100 SMA
The 50-period Simple Moving Average (SMA) has emerged as a support level for Ethereum (ETH), as indicated by the yellow line, slowing down its upward trajectory. Currently, the 50-period SMA acts as a barrier, suggesting that sustained buying pressure or a lack of selling momentum may propel Ethereum’s price beyond this level. Additionally, a bearish reversal occurred late last week, pushing the price down to around $3,000 before rebounding above the March lows. These technical patterns suggest a battle between buyers and sellers in the Ethereum market, with the 50-period SMA providing support and the 20-period SMA potentially serving as resistance.
ETH/USD – Daily chart
- Check out our free forex signals
- Follow the top economic events on FX Leaders economic calendar
- Trade better, discover more Forex Trading Strategies
- Open a FREE Trading Account
- Read our latest reviews on: Avatrade, Exness, HFM and XM
Related Articles


Sidebar rates
Related Posts
