S&P 500 Down for the Week, With Nvidia Stock Leading the Decline
S&P 500 and major stock indices opened the week bearish with a major decline and they are ending it like this, with Nvidia stock falling 10%
S&P 500 and other major stock indices opened the week bearish with a major decline and they are ending it like this, with Nvidia stock falling 10%. However, not all stocks ended up lower, as some made decent gains, while the Nasdaq index posted some gains.
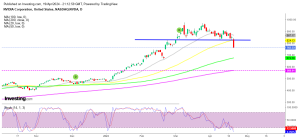
Nvidia Chart Daily – The Support Has Been Broken
The trading week saw uneven performance across major indices, with the Dow Industrial Average eking out a little gain, halting a two-week losing streak. However, the S&P 500 index closed lower for the third week, while the NASDAQ index had its worst trading week since November 2022, falling for the fourth week in a row.
Equities such as Nvidia fell sharply, recording its worst trading day since March 2020, while Tesla stock finished at its lowest level since January 2023, as investors shifted away from large-cap technology stocks towards the relative safety of industrials. The Dow Jones Industrial Average saw gains, while the NASDAQ index experienced a significant decline of 2.2%, marking its biggest drop since January 23.
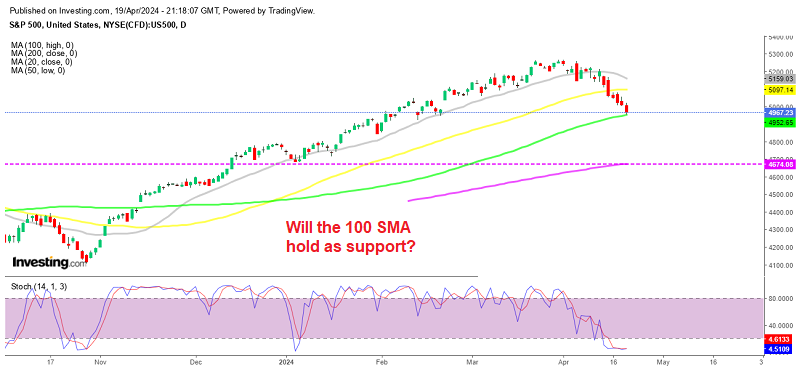
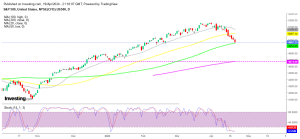
S&P 500 Index Chart Daily – Will the 1o0 SMA Hold As Support?
Here’s a breakdown of the final figures:
- The Dow Industrial Average increased by 211.02 points, or 0.56%, to 37,986.41.
- The S&P 500 index lost 43.87 points, or 0.88%, to 4,967.24. This marked the index’s sixth consecutive negative day.
- The NASDAQ index fell by 319.49 points, or 2.05%, to 15,282.01. Similarly, this marked the index’s sixth consecutive negative day.
S&P 500 Index Live Chart
- Check out our free forex signals
- Follow the top economic events on FX Leaders economic calendar
- Trade better, discover more Forex Trading Strategies
- Open a FREE Trading Account
- Read our latest reviews on: Avatrade, Exness, HFM and XM
Related Articles


Sidebar rates
Related Posts
