Gold Price Forecast: Surges Above $2,400 Amid Iran-Israel Tensions and Fed’s Rate Stance
Gold gained by 2.03% this week and gained by 0.59% the previous week. Meanwhile, on Friday, the US Dollar Index (DXY) gained with 0.52%
Gold gained by 2.03% this week and gained by 0.59% the previous week. Meanwhile, on Friday, the US Dollar Index (DXY) gained with 0.52% and closed at 2391.82.
Global tensions and economic developments impacted trading, resulting in a mixed week for gold prices. Due to safe-haven buying following Iran’s attack in retaliation for a presumed Israeli operation, gold prices surged above $2,400 per ounce early in the week.
However, gold later fell as US officials alluded to potential sanctions on Iran and Western nations urged calm. The Federal Reserve’s remarks regarding interest rates and inflation also had an impact on gold prices.
Meanwhile, Gold also experienced its best daily closing ever despite encouraging US Retail Sales data. But on Tuesday, despite improving market sentiment and hawkish remarks from Fed members that raised US Treasury yields, gold found it difficult to hold onto its gains.
High-ranking Fed officials, such as Chair Jerome Powell, expressed hesitation to lower interest rates in the face of ambiguous inflation data, shattering expectations that rates would be lowered this year.
He said, “More recent data shows solid growth and continued strength in the labor market, but also a lack of further progress so far this year on returning to our 2% inflation goal.”
A more stringent monetary policy is implied by the change in position, which might strengthen the US currency and reduce investor demand for gold as an inflation hedge.
San Francisco Fed President Mary Daly believes that with a robust economy and above-target inflation, there is no need to accelerate the reduction of US interest rates.
It is anticipated that the Fed would keep rates unchanged until September, which might lessen the chance of rate reductions. This might increase the value of the US dollar and reduce the need for gold as a safe-haven investment.
As trading slowed on Thursday, gold saw a little decline. It did, however, temporarily rise again on Friday following news of Israeli strikes on Iran, before falling below $2,400 as tensions subsided.
Investors in gold will be intently monitoring any developments in the Iran-Israel dispute as well as important economic data coming out of the US. The US Bureau of Economic Analysis (BEA) will be the center of attention next week when it releases data on inflation and economic growth in the nation.
Overestimated growth might strengthen the US dollar and lower gold prices. The Personal Consumption Expenditures (PCE) Price Index, which the Federal Reserve uses to gauge inflation, will also be released by the BEA.
In general, geopolitical tensions and economic data may have an impact on gold prices. Gold prices may experience a decline if the Iran-Israel conflict eases and US economic data demonstrates robust expansion.
The need for gold as a haven, however, can be supported by more hostilities or uncertainty in the Middle East.
Gold Price Forecast; Weekly Outlook
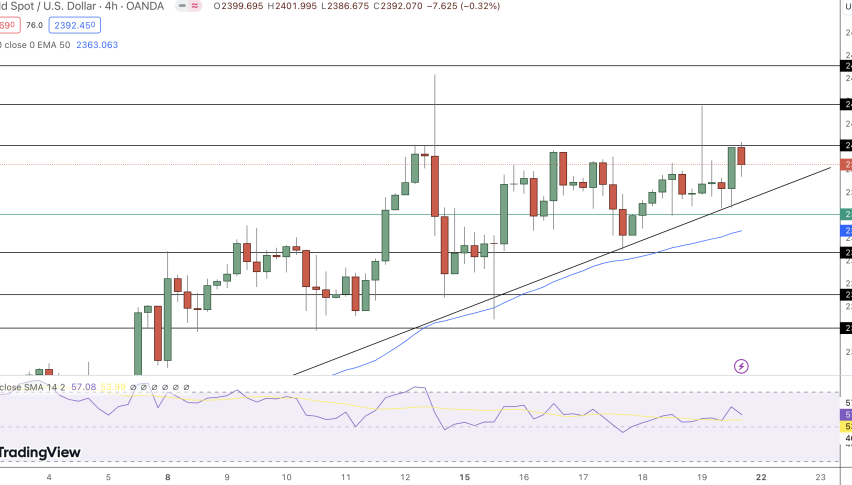
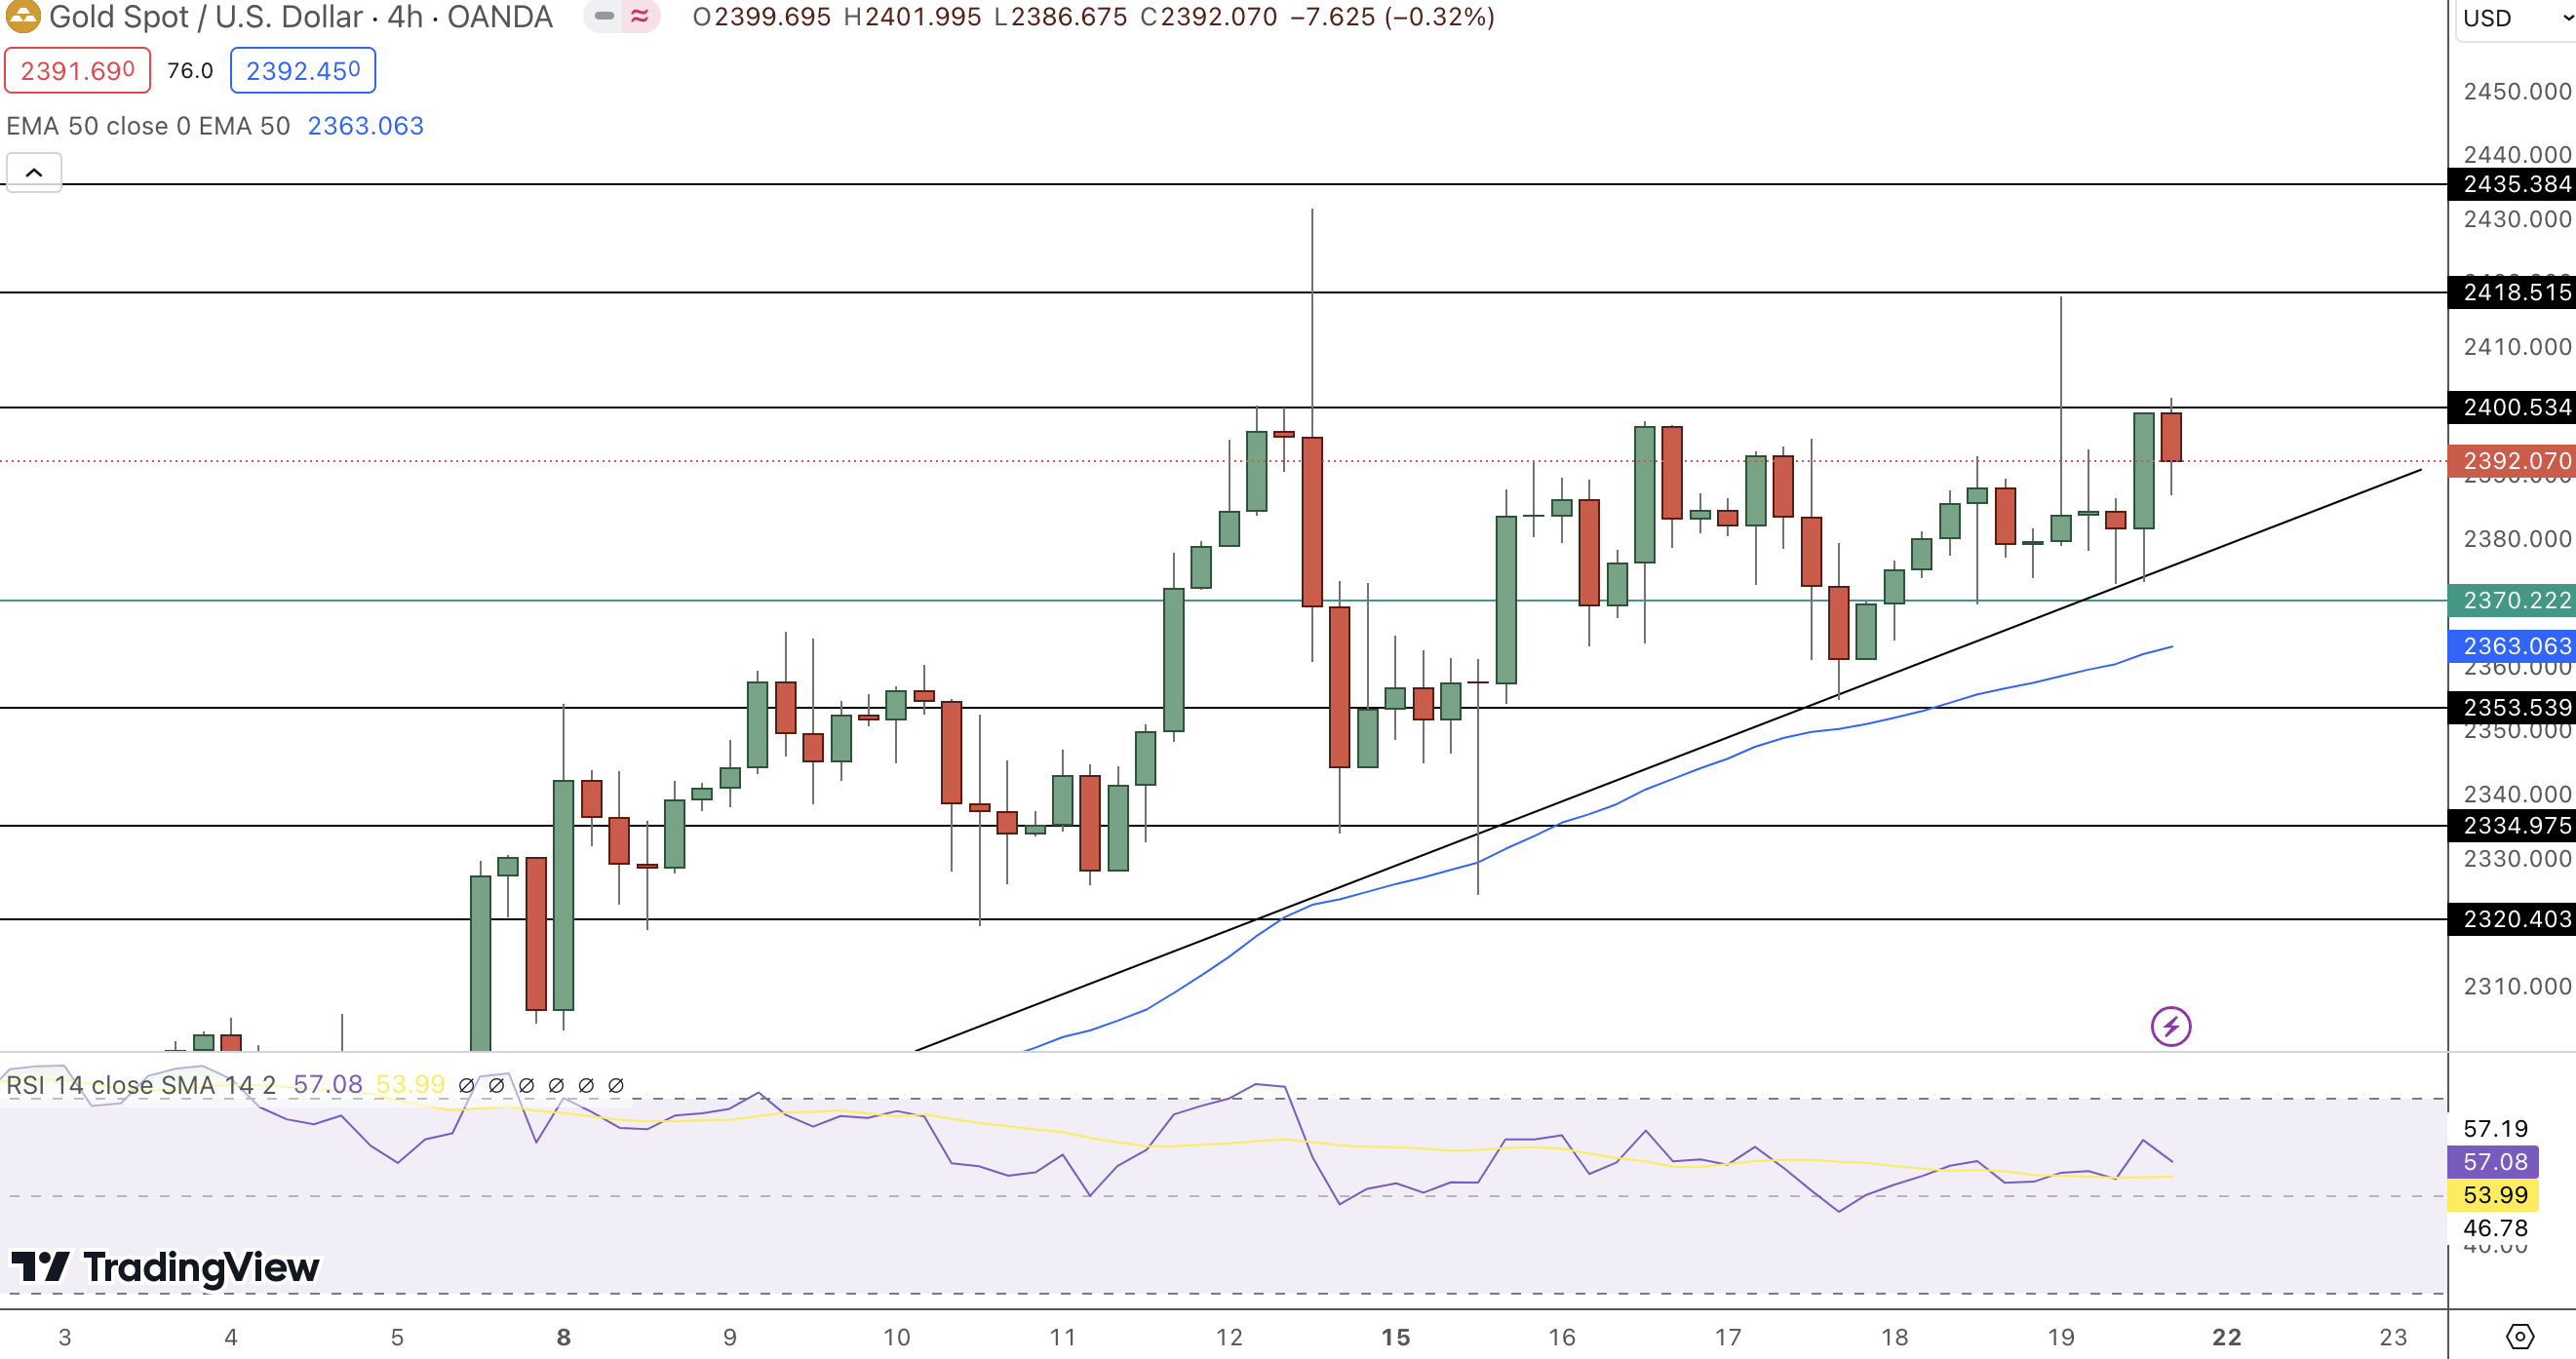
GOLD maintains a positive trajectory today, with its price modestly ascending to $2383.05, reflecting a 0.21% increase.
Currently, the precious metal is trading above the pivot point of $2370.22, suggesting potential for continued upward movement. Immediate resistance is observed at $2400.53, with further ceilings at $2418.52 and $2435.38 that could test the bulls’ persistence.
Conversely, support levels are identified at $2353.54, followed by $2334.98 and $2320.40, marking crucial zones where declines might stabilize, thus inviting buying interest.
The Relative Strength Index (RSI) stands at 54, indicating a neutral market sentiment leaning towards bullish conditions. The 50-Day Exponential Moving Average (EMA) at $2360.39 offers additional support, reinforcing the current price level.
Conclusion: Gold shows bullish potential above $2370, but a dip below this pivotal mark could precipitate a significant sell-off.
- Check out our free forex signals
- Follow the top economic events on FX Leaders economic calendar
- Trade better, discover more Forex Trading Strategies
- Open a FREE Trading Account
- Read our latest reviews on: Avatrade, Exness, HFM and XM
Related Articles


Sidebar rates
Related Posts
