Ethereum Is Fragile? ETH Bulls Fail To Break Above $3,300
Ethereum prices are technically stable when writing, looking at the formation in the daily chart. Bulls need to break above $3,300

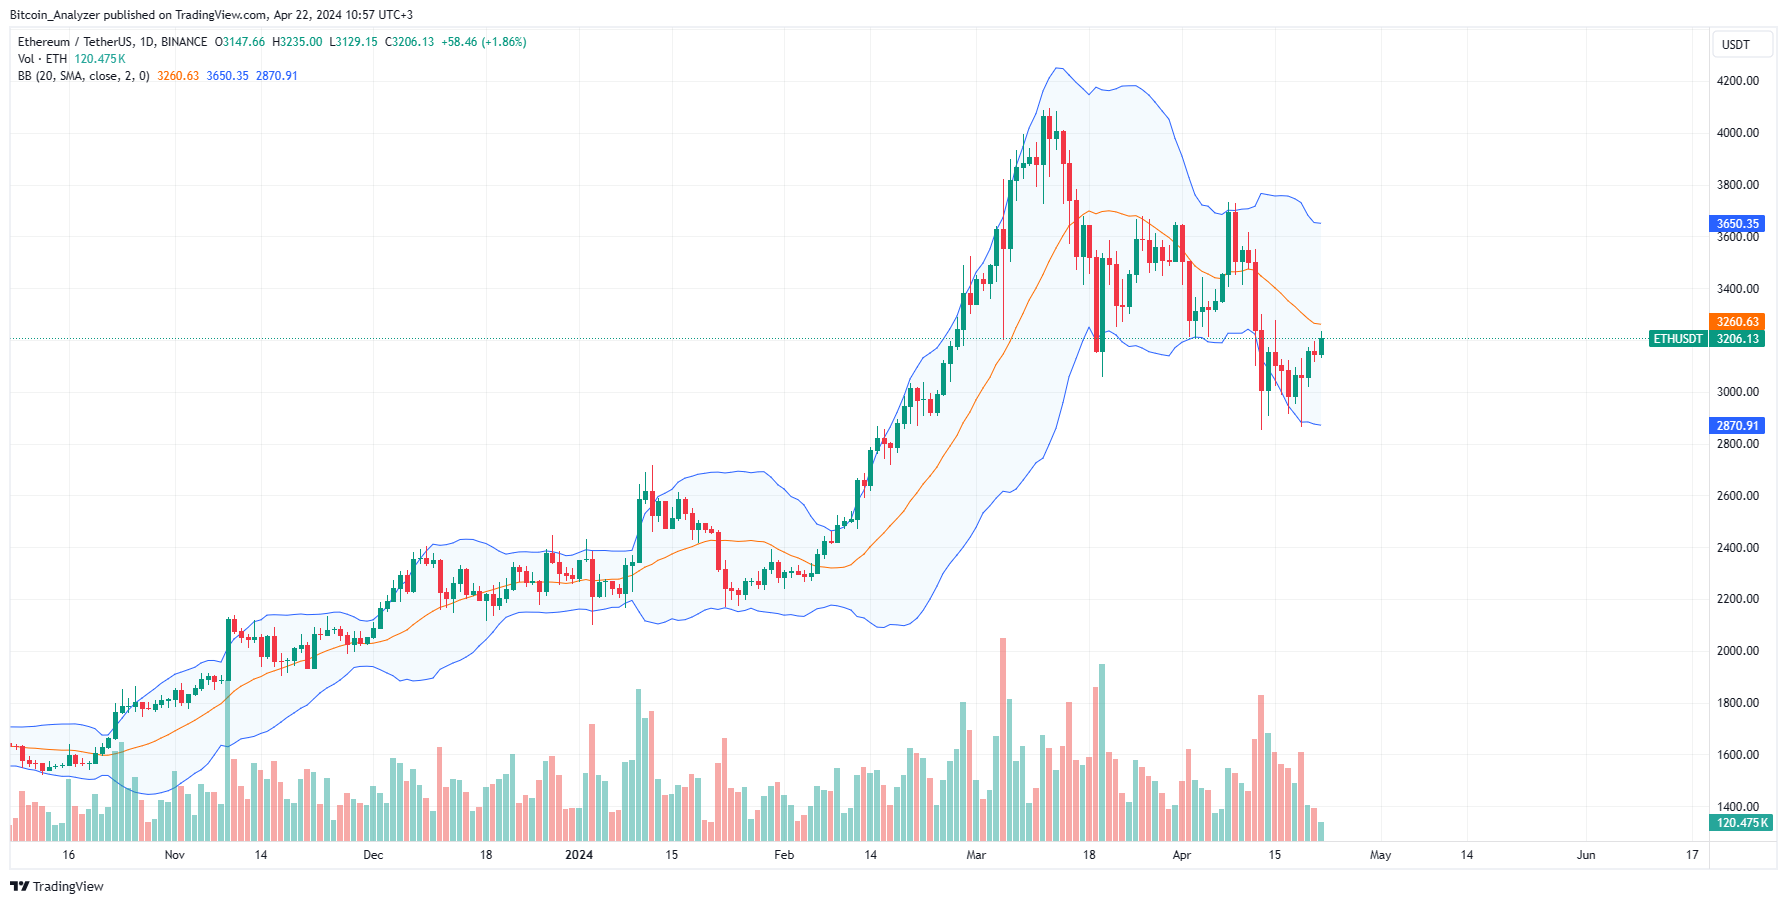
Ethereum, like Bitcoin and other top altcoins, remains inside a trade range and technically bearish. From the daily chart, the coin is changing hands just above $3,100 and moving sideways. Since bulls have been firm but unable to reverse the losses of April 13, sellers still have the upper hand. Of note, the coin remains within a bear breakout formation, with the probability of further losses on the cards if bulls fail to step in. So far, $3,000 and $2,800 are crucial reaction levels to monitor. On the flip side, the momentum could change if buyers break $3,700.
In the past day and week, ETH prices have been flat, looking at price action in the daily chart and trackers. CoinMarketCap data shows that the coin is down 2% in the past week. Meanwhile, trading volume is stable, at $10 billion in the past trading day. Unless otherwise there is a sharp spike in participation, lifting prices as a result, sellers will be in charge in the days to come.
Today, these Ethereum news developments dominated headlines:
- As Bitcoin halves miner rewards, Ethereum has integrated a burning mechanism following the implementation of EIP-1559. Now, based on projections and the current burning rate, ETH will become a deflationary asset. Analysts say its supply will drop below 1% in roughly a year.
- After a week of approval, spot Ethereum ETFs will hit the markets in Hong Kong. These derivative products provide a legal way for institutions to get exposure, injecting more liquidity into the market—a huge development for bulls.
Ethereum Price Analysis
ETH/USD is within a bear formation, even with solid fundamentals.
Looking at the candlestick arrangement in the daily chart, ETH has resistance at $3,700. Meanwhile, support is at around $2,800.
Even with confidence, bulls need to break above $3,300 to incentivize bullish participation.
If not, any drop below $2,800 will trigger more losses, confirming the current sideways movement as distribution.
If sellers take over, Ethereum could crash to $2,600.
- Check out our free forex signals
- Follow the top economic events on FX Leaders economic calendar
- Trade better, discover more Forex Trading Strategies
- Open a FREE Trading Account
- Read our latest reviews on: Avatrade, Exness, HFM and XM
Related Articles


Sidebar rates
Related Posts
