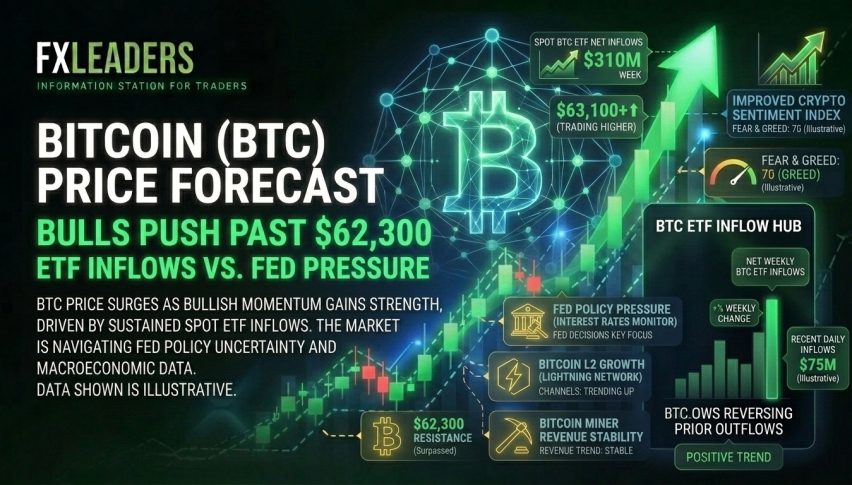
Bitcoin Price Heads to $60K, but Will Likely Bounce to Record Highs
The Bitcoin price has been surging this year as the demand increased since the halving earlier in 2024, but we're seeing a consolidation now
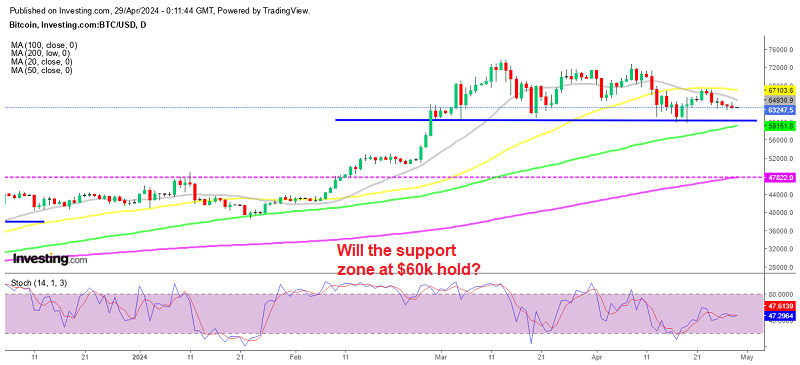
The Bitcoin price has been surging this year as the demand increased since the halving earlier in 2024, but we’re seeing a consolidation right now. However, the downside moves seem week while buyers keep coming at $60,000 where we have been opening buy BTC signals, which will likely hold again and send Bitcoin to new highs.
Bitcoin Chart Daily – The 50 SMA Turned Into Resistance
Following the BTC halving which took place early this year, the price of BITCOIN experienced an increase, surging from around $40,000 to above $70K, establishing a new record high. However, the price retreated below $70,000, but a strong support zone has formed around $40,000. The price has been bouncing from the $60,000 support level however, last week, there were indications of a potential downturn, prompting us to close our BTC signal. The 50 SMA (yellow) turned into resistance on the daily chart and the bearish reversal came, validating our decision, so we are currently waiting for Bitcoin to decline closer to $60,000 before considering opening another buy signal for Bitcoin.
Bitcoin Technical Analysis
Bitcoin’s 100-day moving average (green) is on track to reach the support zone which has been holding during retreats since early March. Currently, this support level and the moving average are crucial indicators for long-term Bitcoin buyers. At the time of reporting, bitcoin was trading below the 50-day average, which stands at $67,000. This holds significance for traders as historical data suggests that the most intense phase of a bullish cycle occurs when the price climbs back above this moving average and will probably exceed the previous high and reaches new all-time highs soon. Many analysts speculate that mounting government debt issues could eventually prompt the US Federal Reserve (Fed) to significantly cut interest rates, thereby driving up risk assets, including cryptocurrencies.
Bitcoin Miner Transaction Fees Down 35% After Halving
On the day of the halving, daily miner revenue jumped to $100 million due to a considerable uptick in BTC transaction fees. Daily network fees soared to an all-time peak of 1,258 BTC ($80 million), constituting 75% of the total earnings for that day. The Runes protocol was the main contributor to the substantial transaction fees. However, less than 24 hours after the halving, transaction fees dropped and remained at low levels. Currently, fees make up 35% of the overall miner revenue, which now stands at around $50 million, reflecting a 35% decrease from the pre-halving record-high levels of approximately $78 million.
Bitcoin Live Chart
- Check out our free forex signals
- Follow the top economic events on FX Leaders economic calendar
- Trade better, discover more Forex Trading Strategies
- Open a FREE Trading Account
- Read our latest reviews on: Avatrade, Exness, HFM and XM
Related Articles

Sidebar rates
Related Posts
