Bitcoin Melting Down: After Slipping 18% in April, Bears Targeting $50,000
Bitcoin is free-falling, dumping below $60,000. With underwhelming reception in Hong Kong, BTC might retest $50,000
Bitcoin collapsed yesterday, marking a weak end to what was overly a bearish month for the world’s most valuable cryptocurrency. To quantify, the coin lost roughly 18% in April alone, contracting sharply from March 2024 highs. As sellers press on, the probability of BTC slipping towards the $50,000 zone cannot be discounted.
At press time, Bitcoin prices are dumping. They are down 8% on the last day and 14% in the previous trading week. The dump is heaping more pressure on holders, forcing weak hands to concede defeat. So far, the average trading volume has increased to $42 billion, rising roughly 70%. Since this dump is backed by increasing trading volumes, it means sellers are in the equation, exiting their longs. As a result, trading volume is rising in tandem.
The following Bitcoin news events are worth watching:
- Even after Hong Kong spot ETF issuers hyped up their offerings, they failed to gain traction as anticipated. At the close of the day yesterday, both spot Ethereum and Bitcoin ETFs had generated slightly over $12 million. This is magnitudes lower than those recorded when spot BTC ETFs began trading in the United States in January 2024.
- Onchain data shows that despite the sell-off, BTC is still within a mid-bull cycle, favoring sellers. The MVRV ratio is at around 2.17, which is in the normal range. Usually, when the ratio spikes above 3.7, the coin tends to sell off strongly.
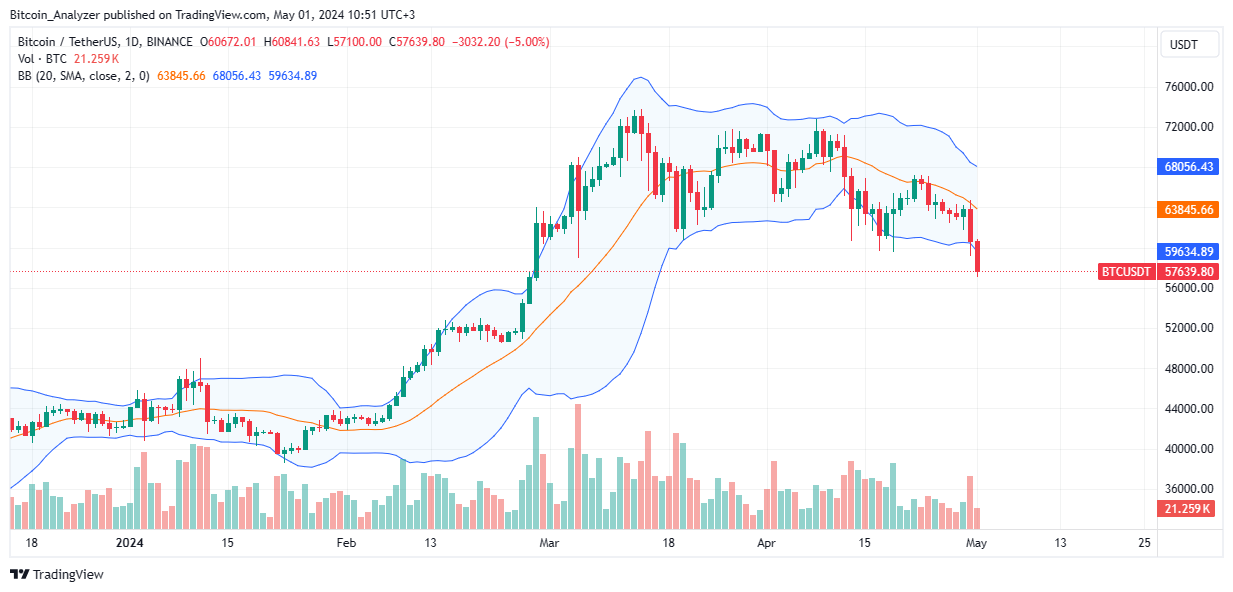
Bitcoin Price Analysis
BTC/USD is dropping fast, looking at the daily chart.
Sellers are in control following the dip below $60,000 at the back of rising trading volume.
After yesterday’s losses, Bitcoin is now aligned with the April 13 dump. Accordingly, traders might look for selling opportunities on every pullback.
The immediate target would be $50,000.
This preview will change if Bitcoin bounces higher, unwinding April 30 losses and surging above $68,000.
- Check out our free forex signals
- Follow the top economic events on FX Leaders economic calendar
- Trade better, discover more Forex Trading Strategies
- Open a FREE Trading Account
- Read our latest reviews on: Avatrade, Exness, HFM and XM
Related Articles


Sidebar rates
Related Posts
