Forex Signals Brief May 6: RBA and BOE Meetings This Week
Last week the attention was on the FOMC and the US NFP, while this week we have the RBA and the BOE meetings which will steal the attention

Last week was all about the FOMC meeting and the Non-Farm Payrolls from the US. The USD was retreating ahead of the FED meeting, and it crashed more than 1 cent lower across the board. The FED kept the higher-for-longer stance regarding interest rates, but FED chairman Jerome Powell rejected the idea of further rate hikes, which was what markets were fearing.

So, that removed the fear premium and the sentiment improved, sending the USD down and risk assets higher. On Friday, we had the US NFP report for April, which indicated that jobs fell below 200k last month, which was below expectations as well, sending the USD lower again. However, the USD reversed most of the losses that day.
This Week’s Market Expectations
This week is light regarding the economic data, but we do have two central bank meeting taking place, with the Reserve Bank of Australia meeting taking place tomorrow, while the Bank of England meeting is scheduled for Thursday. No one is expecting any change in interest rates, but traders will be interested for any hints on policy change in the upcoming months.
- Monday – China Caixin Services PMI
- Tuesday – RBA Monetary Policy Statement, UK Construction PMI
- Wednesday – Crude Oil Inventories
- Thursday – BOE Monetary Policy Report, US Unemployment Claims
- Friday – UK GDP MoM, UK GDPO QoQ, Canada Unemployment Rate, US Prelim UoM Consumer Sentimen
Yesterday the volatility wasn’t too high but there was enough price action to pull several trading signals. However, there were a few reversals during the day, which made it difficult somewhat. We opened five forex signals in total, ending the day with three winning forex signals and two losing ones.
Gold Falls to New Lows After the NFP
Gold prices had been consolidating above $2,300 for several days after dropping from above $2,400. Buyers kept prices within the range of $2,310 to $2,350. However, XAU has resumed its decline, falling below $2,300. The reduction in geopolitical tensions has alleviated risk sentiment in financial markets, leading to reduced demand for gold. Nevertheless, following yesterday’s Federal Open Market Committee (FOMC) meeting, gold prices once again surpassed $2,300. After the NFP we saw a surge higher but the price reversed bck down making a new low below the 200 SMA.
XAU/USD – Daily chart
EUR/USD Finding Resistance at MAs
EUR/USD dropped to a low of 1.06 approximately three weeks ago, then reversed and has been on an upward trend since. It surpassed the 1.07 threshold, signaling potential positive momentum. However, frequent rejection at 1.0750 indicates strong resistance in that area. Last week, the upward trend intensified, and on Friday, EUR/USD exceeded 1.08 in response to disappointing NFP data. However, buyers were unable to break through the 200 SMA (purple), and after briefly surpassing it, the price reversed downward, indicating a rejection.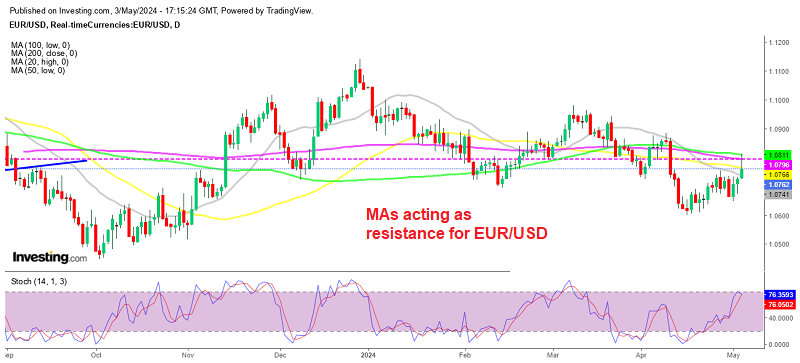
EUR/USD – Daily Chart
Cryptocurrency Update
Bitcoin Starting the Bounce Off the 100 SMA
Bitcoin has dropped below $60,000 after rebounding to $68,000, marking its first decline below this level. Currently, BTC is trading at the 100 Simple Moving Average (SMA) (green line), which serves as daily support. Amidst the dip in BTC/USD, a buy signal was issued, anticipating a rebound in the Bitcoin price to $70,000.
BTC/USD – Daily chart
Ethereum Resurfacing Above $3,000
Ethereum dropped below $3,000, breaking the 100-day Simple Moving Average (SMA) on the daily chart. However, it later managed to recover and climb back above $3,000. Despite making significant gains, the upward momentum of buyers stalled near the 50-day SMA (yellow line), leading to a reversal. While the 100 SMA (green) was breached this week, the price did not stray far from it and remains in close proximity.
ETH/USD – Daily chart
- Check out our free forex signals
- Follow the top economic events on FX Leaders economic calendar
- Trade better, discover more Forex Trading Strategies
- Open a FREE Trading Account
- Read our latest reviews on: Avatrade, Exness, HFM and XM
Related Articles


Sidebar rates
Related Posts
