Forex Signals Brief May 8: Gearing Up for the BOE Tomorrow
Today the economic calendar is almost empty and we expect markets to be quiet as we await the Bank of England meeting tomorrow
Yesterday started with the Reserve Bank of Australia meeting, which left interest rates unchanged as expected, but the Aussie ended up lower at the end of the day, as one of the weakest currencies. That came after the RBA rejected any rate hike comments and pointed at economic weakness instead.
The USD emerged as the strongest currency after two days of decline since Friday, while the JPY was the weakest. Neel Kashkari, a Federal Reserve official, remarked on the housing market’s resilience to tight monetary policy, suggesting that this resilience might signal a temporary elevation in the neutral rate, which he has marginally elevated to 2.5% from 2%.
Despite advancements in inflation during the latter part of 2023, this progress has currently plateaued, prompting concerns about the ongoing efficacy and restrictiveness of prevailing policy measures. European stock markets rose significantly Wednesday, while the major indices in the United States were mixed but little changed. The Dow Industrial Average gained 0.10%. The S&P index increased by 0.15%.
Today’s Market Expectations
Today the economic calendar is pretty light, with the and a few light economic releases from Italy and Germany. The German Industrial Production is expected to show a -0.6% decline in April, after yesterday’s fall in factory orders, while retail sales in Italy are expected to show a 0.2% increase.
In the US session, we have the Final Wholesale Inventories MoM for April and a couple of speeches form FED members. Besides that, we have the EIA crude Oil inventories to be released later, so keep an eye on Oil prices and the events on the Middle East.
Yesterday the volatility was low again and the price action was slow in most forex pair, so we traded Gold once again, which also traded in a tight range. Besides that, we went long on the USD before the small push higher which was enough for a couple of forex signal, so we ended up with two winning trading signals.
Gold Continues to Trade in A Range
Gold prices have remained within the $2,300 range for several days after declining from levels above $2,400. Buyers managed to maintain prices between $2,310 and $2,350. However, gold has resumed its decline, dipping below the $2,300 mark. The easing of geopolitical tensions has reduced risk sentiment in financial markets, leading to decreased demand for gold. Nevertheless, following the Federal Open Market Committee (FOMC) meeting, gold prices rose above $2,300 once again. After the Non-Farm Payrolls (NFP) report, the price initially surged but later reversed course, dipping below the 200 SMA (purple) but reversed back up and is trading between this and the 100 SMA (green) now.
XAU/USD – Daily chart
EUR/GBP Finding Resistance at the 200 SMA
On the EUR/GBP daily chart, the price is currently facing resistance from the 200-bar SMA (purple) at 0.86. Yesterday, the price hesitated at these technical levels, indicating that risks can be identified and mitigated against these dual levels. A break above this level, combined with a move over the higher 100-day SMA at 0.8571, would reinforce the pair’s bullish bias. However, if the price persists below these levels, it may fall further towards the bottom of the range. The present level is a key indicator for both buyers and sellers. A move above the 0.86 moving average would target April’s high, while a failure to do so might cause a reversal by selling, driving the price to the bottom of the range.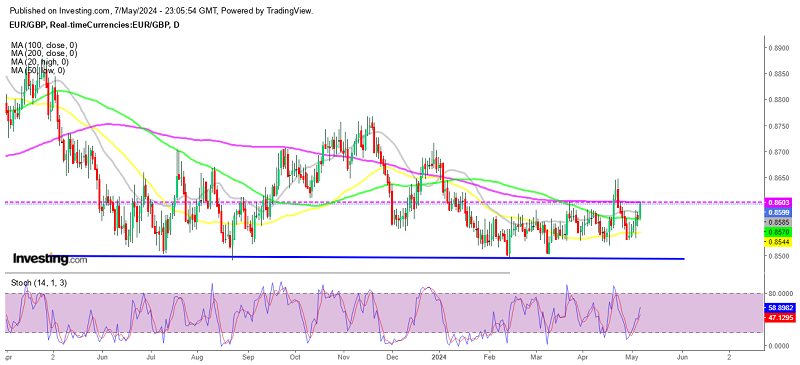
EUR/GBP – Daily Chart
Cryptocurrency Update
The Highs Keep Getting Lower Bitcoin
Bitcoin has dropped below the $60,000 mark after rebounding to $68,000, marking its initial decline below this level. Presently, BTC is trading near the 100 Simple Moving Average (SMA) (green line), which acts as a daily support level. Amidst the decline in BTC/USD, a buy signal emerged, suggesting a potential resurgence in the Bitcoin price to $70,000.
BTC/USD – Daily chart
The 50 SMA Turns into Resistance for Ethereum
Ethereum (ETH) dropped below $3,000, breaching the 100-day Simple Moving Average (SMA) on the daily chart. However, it subsequently recovered and climbed back above the $3,000 mark. Despite significant gains, buyers’ upward momentum faltered near the 50-day SMA (yellow line), leading to a reversal. Although the price surpassed the 100 SMA (green) this week, it remained in close proximity to it.
ETH/USD – Daily chart
- Check out our free forex signals
- Follow the top economic events on FX Leaders economic calendar
- Trade better, discover more Forex Trading Strategies
- Open a FREE Trading Account
- Read our latest reviews on: Avatrade, Exness, HFM and XM
Related Articles


Sidebar rates
Related Posts
